Document Outline
- ˛ˇ
- ˛ˇ
- ˛ˇ
- ˛ˇ
- ˛ˇ
- ˛ˇ
- ˛ˇ
- ˛ˇ
- ˛ˇ
- ˛ˇ
- ˛ˇ
- ˛ˇ
- ˛ˇ
- ˛ˇ
- Gain Input
- ˛ˇ
- Logic InputsÑENB, MODE, and HILO
- ˛ˇ
- ˛ˇ
- ˛ˇ
- ˛ˇ
- ˛ˇ
- LAYOUT, GROUNDING, AND BYPASSING
- ˛ˇ
- ˛ˇ
- MEASUREMENT CONSIDERATIONS
- ˛ˇ
- ˛ˇ
Ultralow Noise VGAs with
Preamplifier and Programmable R
IN
AD8331/AD8332
Rev. D
Information furnished by Analog Devices is believed to be accurate and reliable. However, no
responsibility is assumed by Analog Devices for its use, nor for any infringements of patents or other
rights of third parties that may result from its use. Specifications subject to change without notice. No
license is granted by implication or otherwise under any patent or patent rights of Analog Devices.
Trademarks and registered trademarks are the property of their respective owners.
One Technology Way, P.O. Box 9106, Norwood, MA 02062-9106, U.S.A.
Tel: 781.329.4700
www.analog.com
Fax: 781.461.3113
©2006 Analog Devices, Inc. All rights reserved.
FEATURES
Ultralow noise preamplifier
Voltage noise = 0.74 nV/Hz
Current noise = 2.5 pA/Hz
3 dB bandwidth
AD8331: 120 MHz
AD8332: 100 MHz
Low power
AD8331: 125 mW/channel
AD8332: 145 mW/channel
Wide gain range with programmable postamp
-4.5 dB to +43.5 dB
7.5 dB to 55.5 dB
Low output-referred noise: 48 nV/Hz typical
Active input impedance matching
Optimized for 10-bit/12-bit ADCs
Selectable output clamping level
Single 5 V supply operation
AD8332 available in space-saving, chip scale package
APPLICATIONS
Ultrasound and sonar time-gain controls
High performance AGC systems
I/Q signal processing
High speed dual ADC drivers
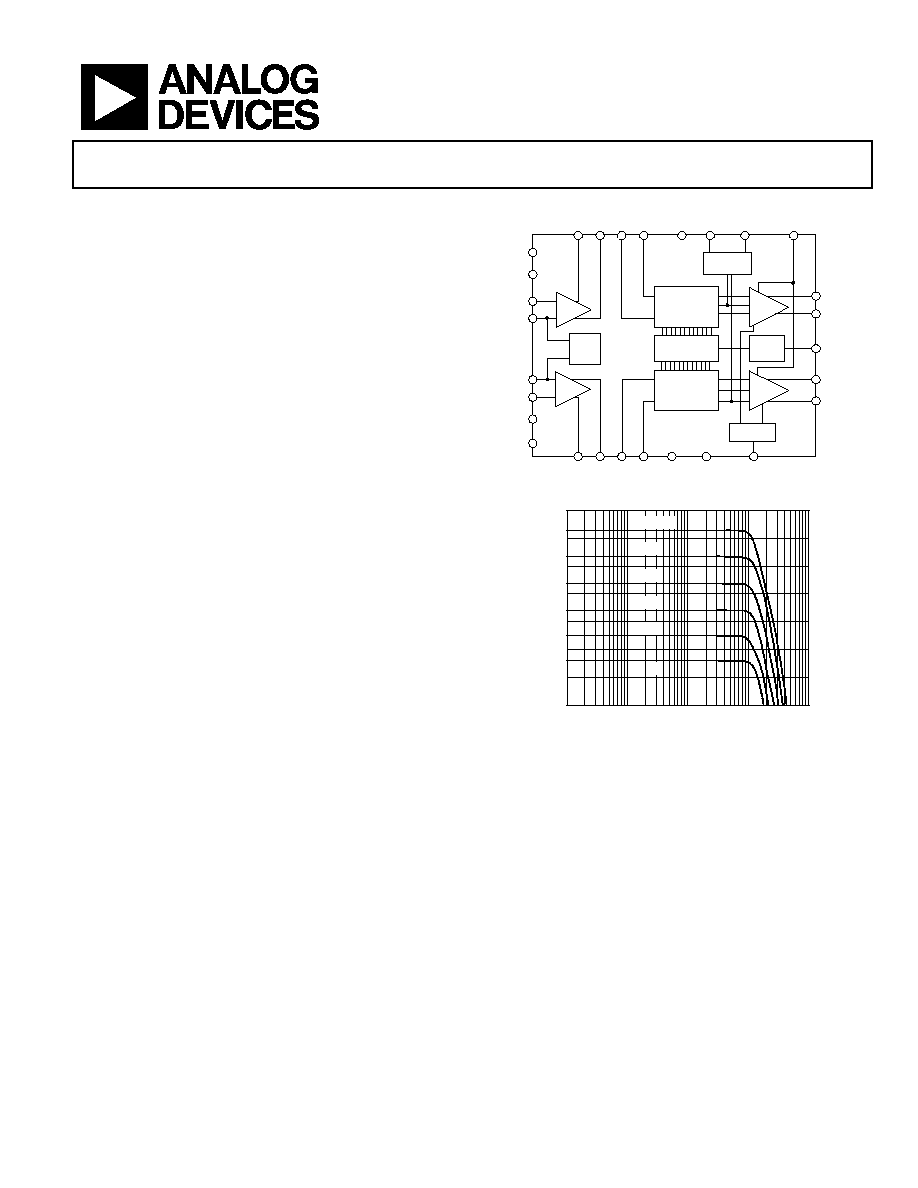
GENERAL DESCRIPTION
The AD8331/AD8332 are single- and dual-channel ultralow
noise, linear-in-dB, variable gain amplifiers (VGAs) usable as
low noise variable gain elements at frequencies up to 120 MHz.
Each channel consists of an ultralow noise preamplifier (LNA),
an X-AMPÆ VGA with 48 dB of gain range, and a selectable gain
postamplifier with adjustable output limiting. The LNA gain is
19 dB with a single-ended input and differential outputs. Using
a single resistor, the LNA input impedance can be adjusted to
match a signal source.
The 48 dB gain range of the VGAs makes these devices suitable
for a variety of applications. Excellent bandwidth uniformity is
maintained across the entire range. The gain control interface
provides precise linear-in-dB scaling of 50 dB/V for control
voltages between 40 mV and 1 V. Factory trim ensures excellent
part-to-part and channel-to-channel gain matching. Differential
signal paths lead to superb second- and third-order distortion
performance and low crosstalk.
FUNCTIONAL BLOCK DIAGRAM
BIAS AND
INTERPOLATOR
VOL1
VPSV
VOH1
V
MID
BIAS
(V
MID
)
COM1
LNA 1
VGA 1
≠
+
≠
+
≠
+
[(≠48 to 0) + 21] dB
≠
+
LNA 2
VGA 2
POST
AMP1
POST
AMP2
ENB
VPS1
26
23
27
28
1
2
3
6
COM2
INH2
LMD2
INH1
LMD1
VPS2
VIN1
VIP1
LOP1
LON1
VIN2
VIP2
LOP2
LON2
GAIN
INT
VOL2
VOH2
GAIN
CLAMP
RCLMP
COMM
HILO
VCM2
VCM1
3.5dB/15.5dB
+19dB
25
24
22
21
15
20
9
19
4
5
7
8
14
18
11
17
16
10
13
12
03199-
B-
001
Figure 1. 28-Lead TSSOP (AD8332 Shown)
G
A
I
N
(
d
B
)
FREQUENCY (Hz)
≠10
0
10
20
40
30
50
100k
≠20
1M
1G
100M
10M
V
GAIN
= 1V
0.8V
0.6V
0.4V
0.2V
0V
03199-
C-
002
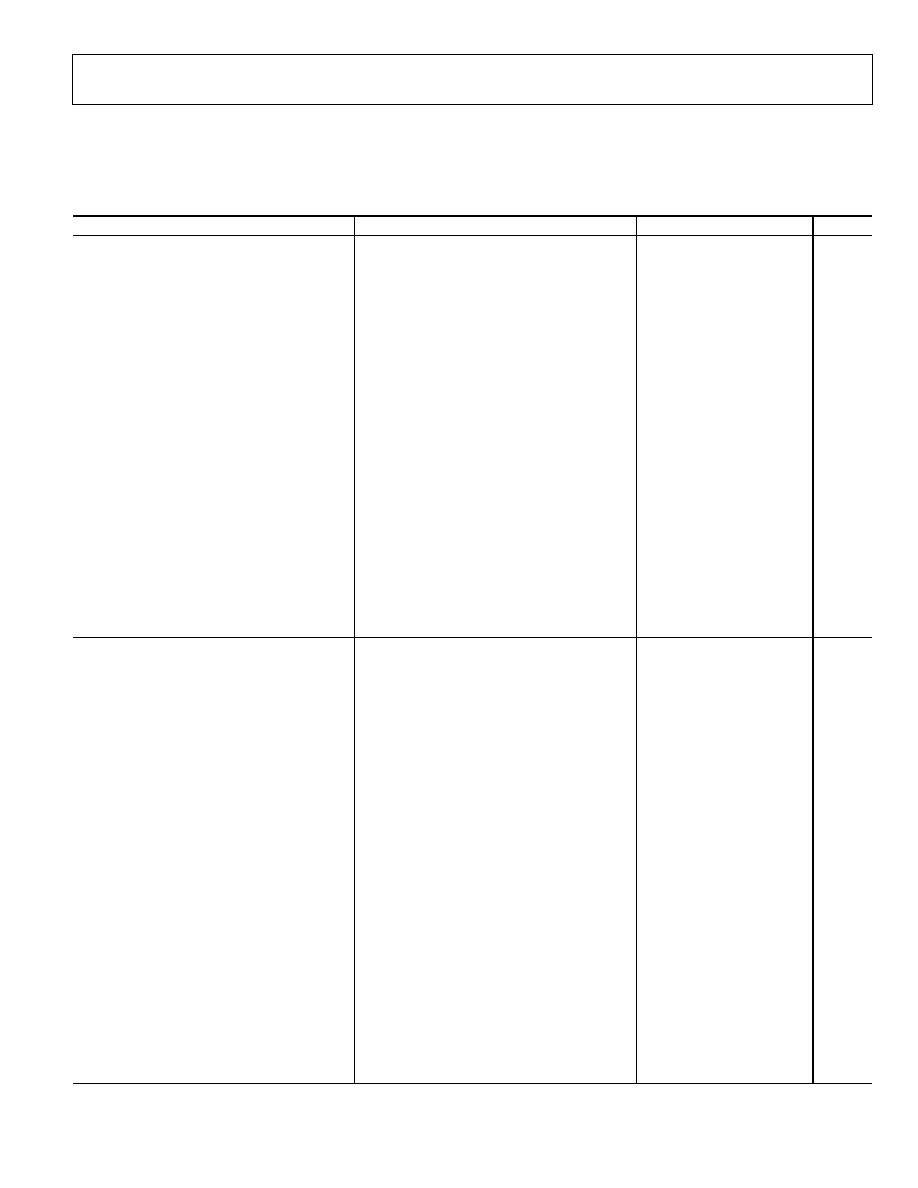
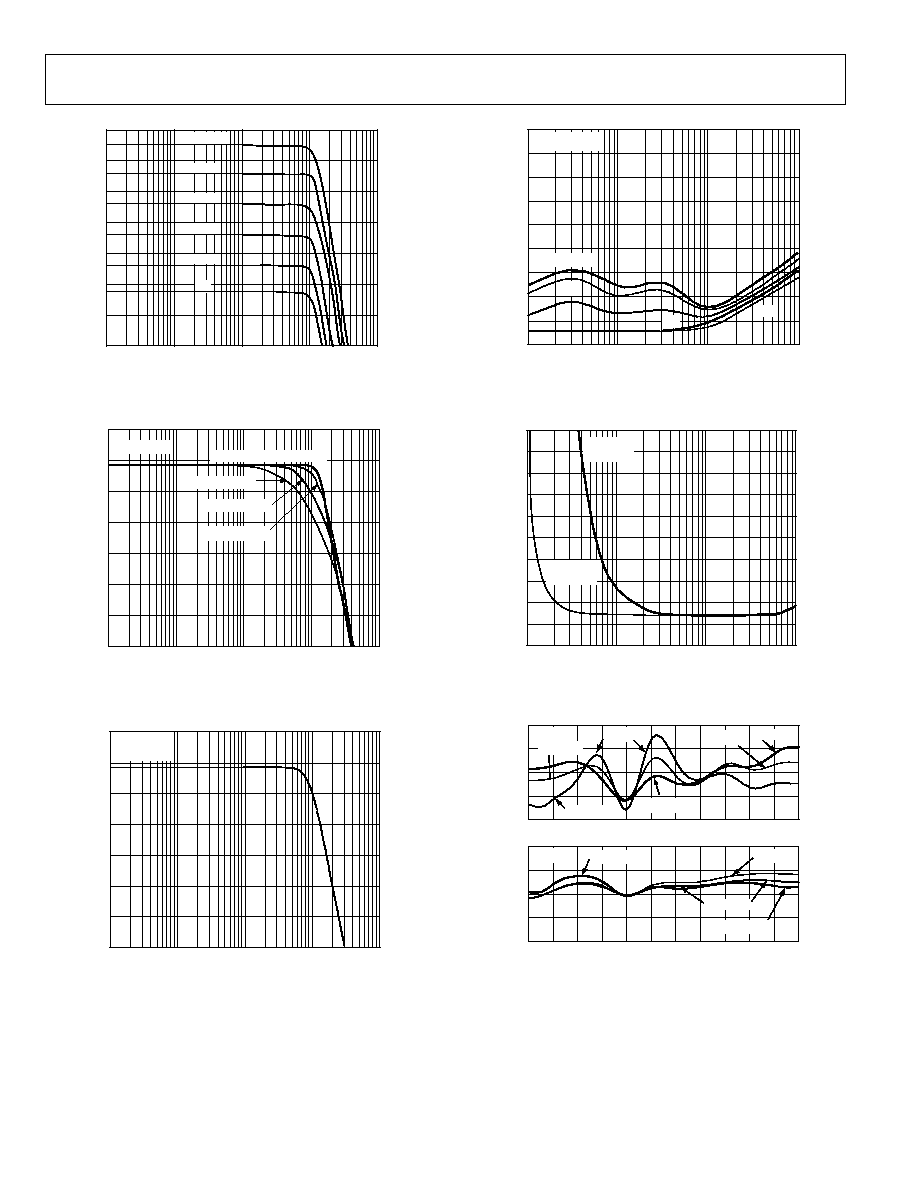
Figure 2. Gain vs. Frequency Response
The VGA's low output-referred noise is advantageous in driving
high speed differential ADCs. The gain of the postamplifier can
be pin selected to 3.5 dB or 15.5 dB to optimize gain range and
output noise for 12-bit or 10-bit converter applications. The
output can be limited to a user-selected clamping level, preventing
input overload to a subsequent ADC. An external resistor
adjusts the clamping level.
The operating temperature range is ≠40∞C to +85∞C. The
AD8331 is available in a 20-lead QSOP package, and the
AD8332 is available in 28-lead TSSOP and 32-lead LFCSP
packages. They require a single 5 V supply.

AD8331/AD8332
Rev. D | Page 2 of 36
TABLE OF CONTENTS
Features .............................................................................................. 1
Applications....................................................................................... 1
General Description ......................................................................... 1
Functional Block Diagram .............................................................. 1
Revision History ............................................................................... 2
Specifications..................................................................................... 3
Absolute Maximum Ratings............................................................ 6
ESD Caution.................................................................................. 6
Pin Configurations and Function Descriptions ........................... 7
Typical Performance Characteristics ............................................. 9
Test Circuits..................................................................................... 17
Theory of Operation ...................................................................... 19
Overview...................................................................................... 19
Low Noise Amplifier (LNA) ..................................................... 19
Variable Gain Amplifier ............................................................ 21
Postamplifier ............................................................................... 23
Applications..................................................................................... 24
LNA--External Components.................................................... 24
Driving ADCs ............................................................................. 26
Overload ...................................................................................... 26
Optional Input Overload Protection ....................................... 27
Layout, Grounding, And Bypassing......................................... 27
Multiple Input Matching ........................................................... 27
Disabling the LNA...................................................................... 27
Measurement Considerations................................................... 28
Ultrasound TGC Application ................................................... 28
Outline Dimensions ....................................................................... 32
Ordering Guide .......................................................................... 33
REVISION HISTORY
3/06--Rev. C to Rev. D
Updated Format..................................................................Universal
Changes to Features and General Description ............................. 1
Changes to Table 1............................................................................ 3
Updated Outline Dimensions ....................................................... 32
Changes to Ordering Guide .......................................................... 33
11/03--Rev. B to Rev. C
Addition of New Part .........................................................Universal
Changes to Figures .............................................................Universal
Updated Outline Dimensions ....................................................... 32
5/03--Rev. A to Rev. B
Edits to Ordering Guide ................................................................ 32
Edits to Ultrasound TGC Application Section........................... 25
Added Figure 71, Figure 72, and Figure 73................................. 26
Updated Outline Dimensions....................................................... 31
2/03--Rev. 0 to Rev. A
Edits to Ordering Guide ................................................................ 32
AD8331/AD8332
Rev. D | Page 3 of 36
SPECIFICATIONS
T
A
= 25∞C, V
S
= 5 V, R
L
= 500 , R
S
= R
IN
= 50 , R
FB
= 280 , C
SH
= 22 pF, f = 10 MHz, R
CLMP
= , C
L
= 1 pF, V
CM
pin floating,
-4.5 dB to +43.5 dB gain (HILO = LO), and differential output voltage, unless otherwise specified.
Table 1.
Parameter Conditions Min
Typ
Max
Unit
LNA
CHARACTERISTICS
Gain
Single-ended input to differential
output 19
dB
Input to output (single ended)
13
dB
Input
Voltage
Range
AC-coupled
±275 mV
Input Resistance
R
FB
= 280
50
R
FB
= 412
75
R
FB
= 562
100
R
FB
= 1.13 k
200
R
FB
=
6
k
Input
Capacitance
13
pF
Output Impedance
Single-ended, either output
5
-3 dB Small Signal Bandwidth
V
OUT
= 0.2 V p-p
130
MHz
Slew
Rate
650
V/s
Input Voltage Noise
R
S
= 0 , HI or LO gain, R
FB
= , f = 5 MHz
0.74
nV/Hz
Input Current Noise
R
FB
= , HI or LO gain, f = 5 MHz
2.5
pA/Hz
Noise Figure
f = 10 MHz, LOP output
Active Termination Match
R
S
= R
IN
= 50
3.7
dB
Unterminated R
S
= 50 , R
FB
=
2.5
dB
Harmonic Distortion @ LOP1 or LOP2
V
OUT
= 0.5 V p-p, single-ended, f = 10 MHz
HD2
-56
dBc
HD3
-70
dBc
Output Short-Circuit Current
Pin LON, Pin LOP
165
mA
LNA + VGA CHARACTERISTICS
-3 dB Small Signal Bandwidth
V
OUT
= 0.2 V p-p
AD8331
120
MHz
AD8332
100
MHz
-3 dB Large Signal Bandwidth
V
OUT
= 2 V p-p
AD8331
110
MHz
AD8332
90
MHz
Slew
Rate
V/s
AD8331
LO
gain
300
V/s
HI
gain
1200
AD8332
LO
gain
275
HI
gain
1100
Input Voltage Noise
R
S
= 0 , HI or LO gain, R
FB
= , f = 5 MHz
0.82
nV/Hz
Noise Figure
V
GAIN
= 1.0 V
Active Termination Match
R
S
= R
IN
= 50 , f = 10 MHz, measured
4.15
dB
R
S
= R
IN
= 200 , f = 5 MHz, simulated
2.0
dB
Unterminated R
S
= 50 , R
FB
= , f = 10 MHz, measured
2.5
dB
R
S
= 200 , R
FB
= , f = 5 MHz, simulated
1.0
dB
Output-Referred
Noise
AD8331 V
GAIN
= 0.5 V, LO gain
48
nV/Hz
V
GAIN
= 0.5 V, HI gain
178
nV/Hz
AD8332 V
GAIN
= 0.5 V, LO gain
40
nV/Hz
V
GAIN
= 0.5 V, HI gain
150
nV/Hz
Output Impedance, Postamplifier
DC to 1 MHz
1
AD8331/AD8332
Rev. D | Page 4 of 36
Parameter Conditions Min
Typ
Max
Unit
Output Signal Range, Postamplifier
R
L
500 , unclamped, either pin
V
CM
± 1.125
V
Differential
4.5
V
p-p
Output Offset Voltage
V
GAIN
= 0.5 V
AD8331
Differential
-50 ±5
+50 mV
Common
mode
-125 -25
+100 mV
AD8332
Differential
-20 ±5
+20 mV
Common
mode
-125 ≠25
+100 mV
Output Short-Circuit Current
45
mA
Harmonic Distortion
V
GAIN
= 0.5 V, V
OUT
= 1 V p-p, HI gain
AD8331
HD2
f = 1 MHz
-88
dBc
HD3
-85
dBc
HD2
f = 10 MHz
-68
dBc
HD3
-65
dBc
AD8332
HD2
f = 1 MHz
-82
dBc
HD3
-85
dBc
HD2
f = 10 MHz
-62
dBc
HD3
-66
dBc
Input 1 dB Compression Point
V
GAIN
= 0.25 V, V
OUT
= 1 V p-p, f = 1 MHz to 10 MHz
AD8331
7
dBm
1
AD8332
3.5
dBm
Two-Tone Intermodulation Distortion (IMD3)
AD8331 V
GAIN
= 0.72 V, V
OUT
= 1 V p-p, f = 1 MHz
-80
dBc
V
GAIN
= 0.5 V, V
OUT
= 1 V p-p, f = 10 MHz
-72
dBc
AD8332 V
GAIN
= 0.72 V, V
OUT
= 1 V p-p, f = 1 MHz
-78
dBc
V
GAIN
= 0.5 V, V
OUT
= 1 V p-p, f = 10 MHz
-74
dBc
Output
Third-Order
Intercept
AD8331 V
GAIN
= 0.5 V, V
OUT
= 1 V p-p, f = 1 MHz
38
dBm
V
GAIN
= 0.5 V, V
OUT
= 1 V p-p, f = 10 MHz
33
dBm
AD8332 V
GAIN
= 0.5 V, V
OUT
= 1 V p-p, f = 1 MHz
35
dBm
V
GAIN
= 0.5 V, V
OUT
= 1 V p-p, f = 10 MHz
32
dBm
Channel-to-Channel Crosstalk (AD8332)
V
GAIN
= 0.5 V, V
OUT
= 1 V p-p, f = 1 MHz
-98
dB
Overload Recovery
V
GAIN
= 1.0 V, V
IN
= 50 mV p-p/1 V p-p, f = 10 MHz
5
ns
Group Delay Variation
5 MHz < f < 50 MHz, full gain range
±2
ns
ACCURACY
Absolute Gain Error
2
0.05 V < V
GAIN
< 0.10 V
-1
+0.5
+2
dB
0.10
V
<
V
GAIN
< 0.95 V
-1
±0.3
+1
dB
0.95
V
<
V
GAIN
< 1.0 V
-2
-1
+1
dB
Gain Law Conformance
3
0.1 V < V
GAIN
< 0.95 V
±0.2
dB
Channel-to-Channel Gain Matching
0.1 V < V
GAIN
< 0.95 V
±0.1
dB
GAIN CONTROL INTERFACE (Pin GAIN)
Gain Scaling Factor
0.10 V < V
GAIN
< 0.95 V
50
dB/V
Gain Range
LO gain
-4.5 to +43.5
dB
HI gain
7.5 to 55.5
dB
Input Voltage (V
GAIN
)
Range
0
to
1.0 V
Input
Impedance
10
M
Response Time
48 dB gain change to 90% full scale
500
ns
COMMON-MODE
INTERFACE
(PIN
VCMn)
Input Resistance
Current limited to ±1 mA
30
Output CM Offset Voltage
V
CM
= 2.5 V
-125
-25
+100
mV
Voltage Range
V
OUT
= 2.0 V p-p
1.5 to 3.5
V
AD8331/AD8332
Rev. D | Page 5 of 36
Parameter Conditions Min
Typ
Max
Unit
ENABLE INTERFACE
(PIN ENB, PIN ENBL, PIN ENBV)
Logic Level to Enable Power
2.25
5
V
Logic Level to Disable Power
0
1.0
V
Input
Resistance
Pin
ENB
25
k
Pin
ENBL
40
k
Pin
ENBV
70
k
Power-Up Response Time
V
INH
= 30 mV p-p
300
s
V
INH
= 150 mV p-p
4
ms
HILO GAIN RANGE INTERFACE (PIN HILO)
Logic Level to Select HI Gain Range
2.25
5
V
Logic Level to Select LO Gain Range
0
1.0
V
Input
Resistance
50
k
OUTPUT CLAMP INTERFACE
(PIN RCLMP; HI OR LO GAIN)
Accuracy
HILO = LO
R
CLMP
= 2.74 k, V
OUT
= 1 V p-p (clamped)
±50
mV
HILO = HI
R
CLMP
= 2.21 k, V
OUT
= 1 V p-p (clamped)
±75
mV
MODE INTERFACE (PIN MODE)
Logic Level for Positive Gain Slope
0
1.0
V
Logic Level for Negative Gain Slope
2.25
5
V
Input
Resistance
200
k
POWER SUPPLY (PIN VPS1, PIN VPS2,
PIN VPSV, PIN VPSL, PIN VPOS)
Supply
Voltage
4.5 5.0
5.5 V
Quiescent Current per Channel
AD8331
25
mA
AD8332
29
mA
Power Dissipation per channel
No signal
AD8331
125
mW
AD8332
145
mW
Disable
Current
AD8332 (VGA and LNA)
300
600
A
AD8331 (VGA and LNA)
240
400
A
AD8332 (ENBL)
Each channel
12
mA
AD8332 (ENBV)
Each channel
17
mA
AD8331
(ENBL)
11
mA
AD8331
(ENBV)
14
mA
PSRR V
GAIN
= 0 V, f = 100 kHz
-68
dB
1
All dBm values are referred to 50 , unless otherwise noted.
2
Conformance to theoretical gain expression (see Equation 1).
3
Conformance to best-fit dB linear curve.
AD8331/AD8332
Rev. D | Page 6 of 36
ABSOLUTE MAXIMUM RATINGS
Table 2.
Parameter Rating
Voltage
Supply Voltage (VPSn, VPSV, VPSL, VPOS)
5.5 V
Input Voltage (INHn)
V
S
+ 200 mV
ENB, ENBL, ENBV, HILO Voltage
V
S
+ 200 mV
GAIN Voltage
2.5 V
Power Dissipation
RU-28 Package (AD8332)
1
0.96 W
CP-32 Package (AD8332)
2
1.97 W
RQ-20 Package (AD8331)
1
0.78 W
Temperature
Operating Temperature
≠40∞C to +85∞C
Storage Temperature
≠65∞C to +150∞C
Lead Temperature (Soldering 60 sec)
300∞C
JA
RU-28 Package (AD8332)
1
68∞C/W
CP-32 Package (AD8332)
2
33∞C/W
RQ-20 Package (AD8331)
1
83∞C/W
JC
RU-28 Package (AD8332)
1
14∞C/W
CP-32 Package (AD8332)
2
33∞C/W
1
Four-layer JEDEC board (2S2P).
2
Exposed pad soldered to board, nine thermal vias in pad--JEDEC, 4-layer
board, J-STD-51-9.
Stresses above those listed under Absolute Maximum Ratings
may cause permanent damage to the device. This is a stress
rating only; functional operation of the device at these or any
other conditions above those indicated in the operational
section of this specification is not implied. Exposure to absolute
maximum rating conditions for extended periods may affect
device reliability.
ESD CAUTION
ESD (electrostatic discharge) sensitive device. Electrostatic charges as high as 4000 V readily accumulate on
the human body and test equipment and can discharge without detection. Although this product features
proprietary ESD protection circuitry, permanent damage may occur on devices subjected to high energy
electrostatic discharges. Therefore, proper ESD precautions are recommended to avoid performance
degradation or loss of functionality.
AD8331/AD8332
Rev. D | Page 7 of 36
PIN CONFIGURATIONS AND FUNCTION DESCRIPTIONS
MODE
RCLMP
VIP
GAIN
VIN
LOP
COML
LMD
LON
VPSL
INH
COMM
VOH
ENBV
VCM
VPOS
VOL
HILO
ENBL
COMM
03199-C-079
1
2
3
4
5
6
7
8
9
10
20
19
18
17
16
15
14
13
12
11
PIN 1
IDENTIFIER
AD8331
TOP VIEW
(Not to Scale)
Figure 3. 20-Lead QSOP Pin Configuration (AD8331)
Table 3. 20-Lead QSOP Pin Function Description (AD8331)
Pin No.
Mnemonic
Description
1
LMD
LNA Signal Ground
2 INH
LNA
Input
3
VPSL
LNA 5 V Supply
4 LON
LNA
Inverting
Output
5
LOP
LNA Noninverting Output
6 COML
LNA
Ground
7
VIP
VGA Noninverting Input
8 VIN
VGA
Inverting
Input
9
MODE
Gain Slope Logic Input
10 GAIN
Gain
Control
Voltage
11 VCM
Common-Mode
Voltage
12
RCLMP
Output Clamping Level
13
HILO
Gain Range Select (HI or LO)
14
VPOS
VGA 5 V Supply
15 VOH
Noninverting
VGA
Output
16 VOL
Inverting
VGA
Output
17 COMM
VGA
Ground
18
ENBV
VGA Enable
19 ENBL
LNA
Enable
20 COMM
VGA
Ground
AD8331/AD8332
Rev. D | Page 8 of 36
COM1
LOP1
LMD1
LON1
VPS1
INH1
VOH1
ENB
VIP1
VCM1
VIN1
VPSV
VOL1
HILO
VCM2
RCLMP
COMM
VOL2
VOH2
VIP2
GAIN
VIN2
LOP2
COM2
LMD2
LON2
VPS2
INH2
03199-B
-
081
1
2
3
4
5
6
7
8
9
10
11
12
13
14
28
27
26
25
24
23
22
21
20
19
18
17
16
15
PIN 1
IDENTIFIER
AD8332
TOP VIEW
(Not to Scale)
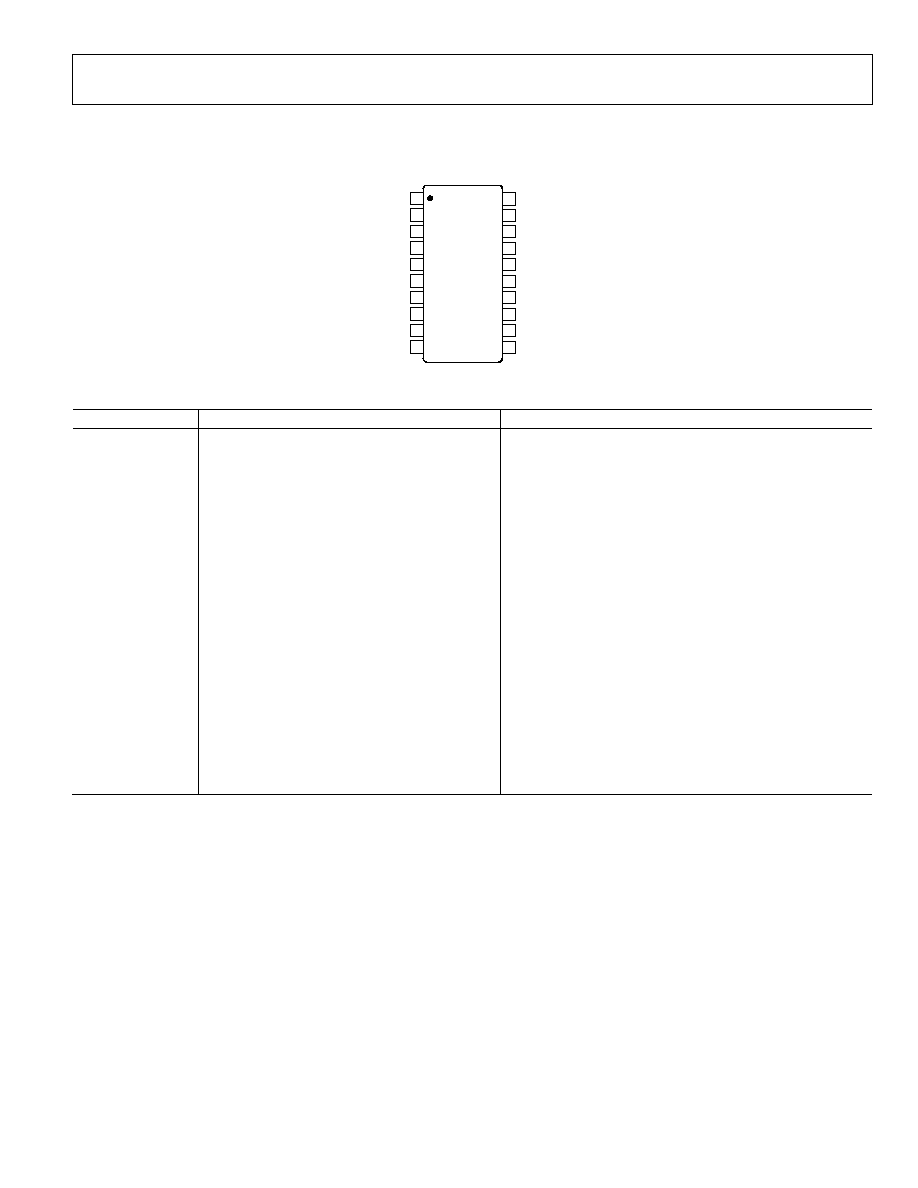
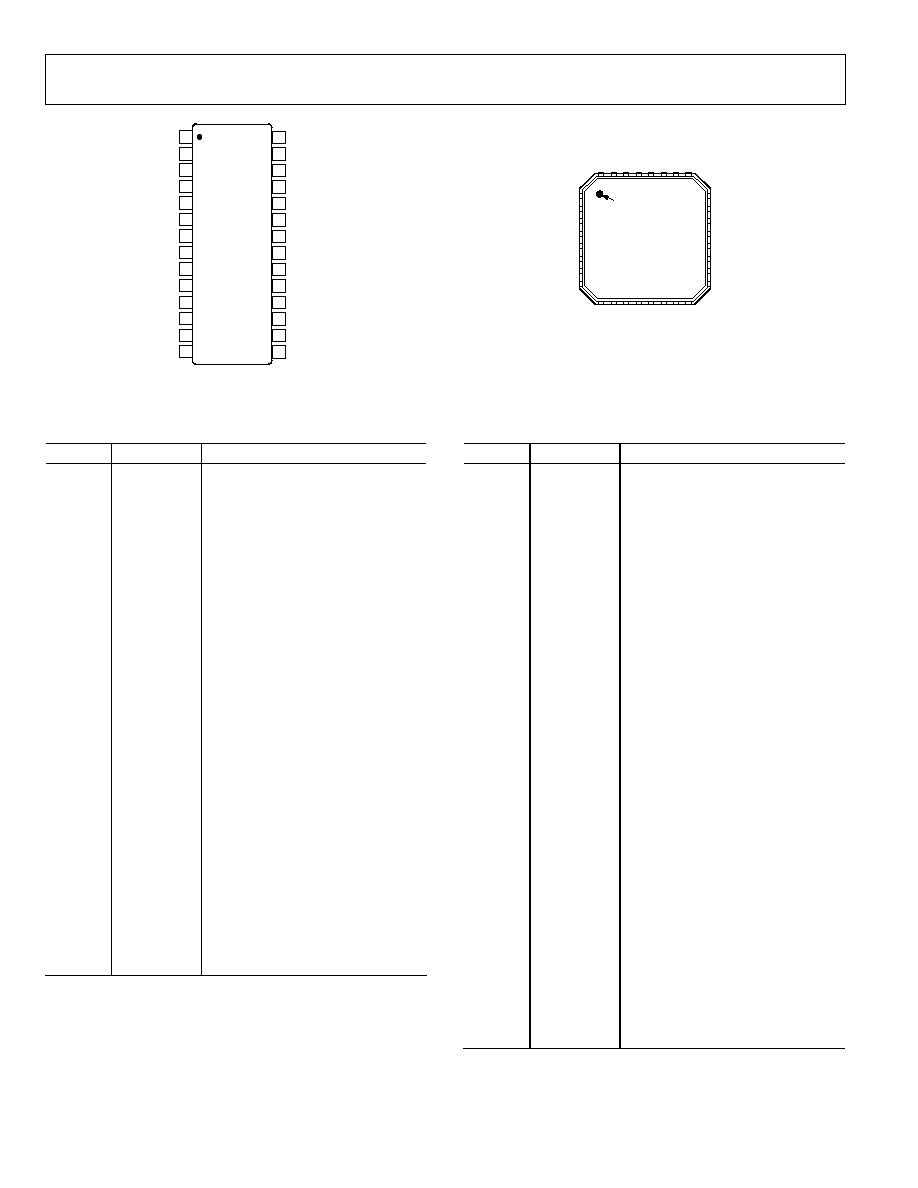
Figure 4. 28-Lead TSSOP Pin Configuration (AD8332)
AD8332
TOP VIEW
(Not to Scale)
LMD2
LON2
VPS2
INH2
LMD1
LON1
VPS1
INH1
VIP2
VIN
2
LOP2
COM2
14
13
9
12
11
10
RCLMP
GAIN
15 16
VC
M
2
MO
DE
COMM
VOL2
VOH2
20
17
18
19
VOH1
VOL1
21
22
23
24
NC
VPSV
COMM
29
30
31
32
28
25
26
27
COM1
LOP1
VIP1
VIN
1
HI
LO
E
NBL
VC
M
1
E
NBV
03199-C-082
1
2
3
4
5
6
7
8
PIN 1
INDICATOR
NC = NO CONNECT
Figure 5. 32-Lead LFCSP Pin Configuration (AD8332)
Table 4. 28-Lead TSSOP Pin Function Description (AD8332)
Pin No.
Mnemonic
Description
1
LMD2
CH2 LNA Signal Ground
2 INH2 CH2
LNA
Input
3
VPS2
CH2 Supply LNA 5 V
4
LON2
CH2 LNA Inverting Output
5
LOP2
CH2 LNA Noninverting Output
6
COM2
CH2 LNA Ground
7
VIP2
CH2 VGA Noninverting Input
8
VIN2
CH2 VGA Inverting Input
9 VCM2 CH2
Common-Mode
Voltage
10 GAIN Gain
Control
Voltage
11
RCLMP
Output Clamping Resistor
12
VOH2
CH2 Noninverting VGA Output
13
VOL2
CH2 Inverting VGA Output
14
COMM
VGA Ground (Both Channels)
15
VPSV
VGA Supply 5 V (Both Channels)
16
VOL1
CH1 Inverting VGA Output
17
VOH1
CH1 Noninverting VGA Output
18 ENB
Enable--VGA/LNA
19
HILO
VGA Gain Range Select (HI or LO)
20 VCM1 CH1
Common-Mode
Voltage
21
VIN1
CH1 VGA Inverting Input
22
VIP1
CH1 VGA Noninverting Input
23
COM1
CH1 LNA Ground
24
LOP1
CH1 LNA Noninverting Output
25
LON1
CH1 LNA Inverting Output
26
VPS1
CH1 LNA Supply 5 V
27 INH1 CH1
LNA
Input
28
LMD1
CH1 LNA Signal Ground
Table 5. 32-Lead LFCSP Pin Function Description (AD8332)
Pin No.
Mnemonic
Description
1
LON1
CH1 LNA Inverting Output
2
VPS1
CH1 LNA Supply 5 V
3 INH1 CH1
LNA
Input
4
LMD1
CH1 LNA Signal Ground
5
LMD2
CH2 LNA Signal Ground
6 INH2 CH2
LNA
Input
7
VPS2
CH2 LNA Supply 5 V
8
LON2
CH2 LNA Inverting Output
9
LOP2
CH2 LNA Noninverting Output
10
COM2
CH2 LNA Ground
11
VIP2
CH2 VGA Noninverting Input
12
VIN2
CH2 VGA Inverting Input
13 VCM2 CH2
Common-Mode
Voltage
14
MODE
Gain Slope Logic Input
15 GAIN Gain
Control
Voltage
16
RCLMP
Output Clamping Level Input
17 COMM VGA
Ground
18
VOH2
CH2 Noninverting VGA Output
19
VOL2
CH2 Inverting VGA Output
20 NC
Not
Connected
21
VPSV
VGA Supply 5 V
22
VOL1
CH1 Inverting VGA Output
23
VOH1
CH1 Noninverting VGA Output
24 COMM VGA
Ground
25 ENBV VGA
Enable
26 ENBL LNA
Enable
27
HILO
VGA Gain Range Select (HI or LO)
28 VCM1 CH1
Common-Mode
Voltage
29
VIN1
CH1 VGA Inverting Input
30
VIP1
CH1 VGA Noninverting Input
31
COM1
CH1 LNA Ground
32
LOP1
CH1 LNA Noninverting Output
AD8331/AD8332
Rev. D | Page 9 of 36
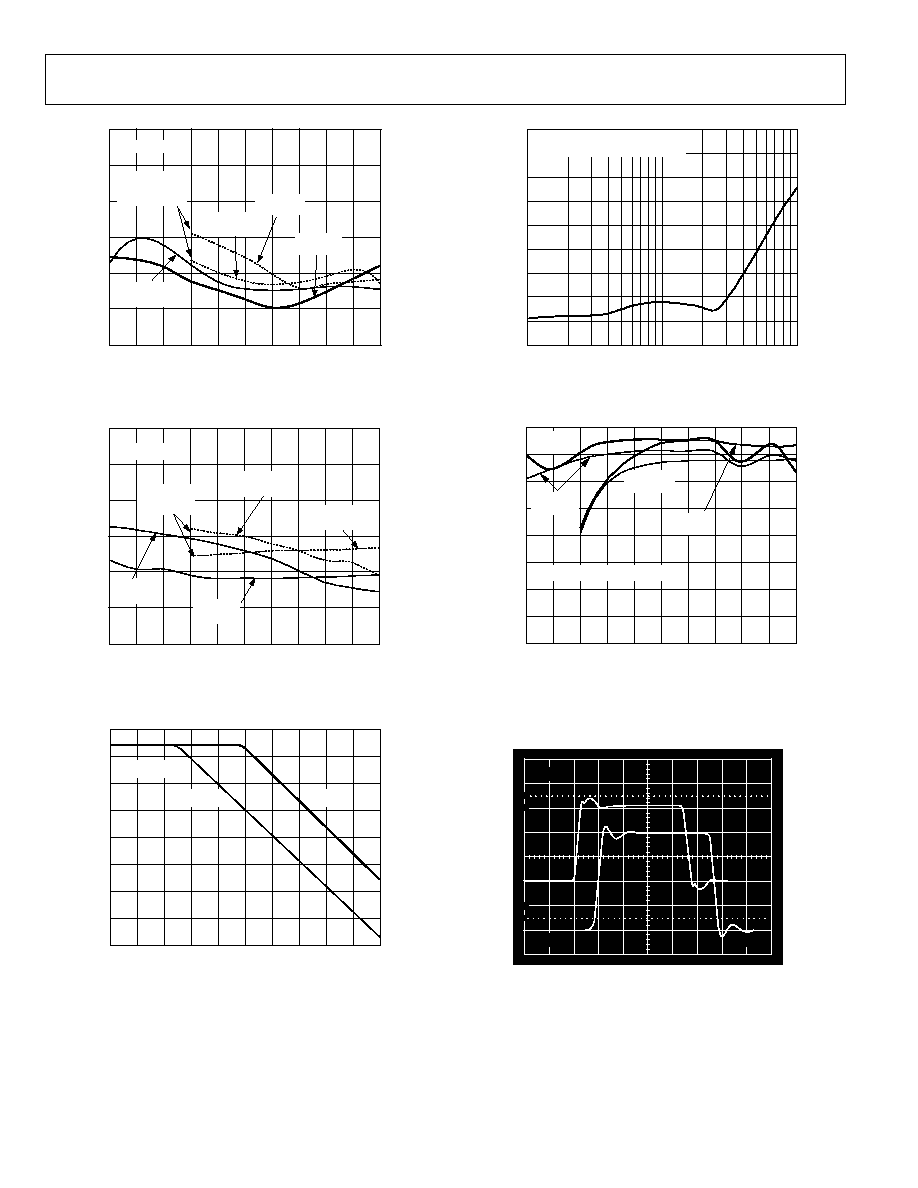
TYPICAL PERFORMANCE CHARACTERISTICS
T
A
= 25∞C, V
S
= 5 V, R
L
= 500 , R
S
= R
IN
= 50 , R
FB
= 280 , C
SH
= 22 pF, f = 10 MHz, R
CLMP
= , C
L
= 1 pF, V
CM
= 2.5 V, -4.5 dB to
+43.5 dB gain (HILO = LO), and differential signal voltage, unless otherwise specified.
0
0.2
V
GAIN
(V)
0.6
0.4
1.0
0.8
1.1
G
A
I
N
(
d
B
)
40
50
30
10
0
20
≠10
60
MODE = HI
(AC PACKAGE
ONLY)
MODE = LO
HILO = LO
03199-C-003
HILO = HI
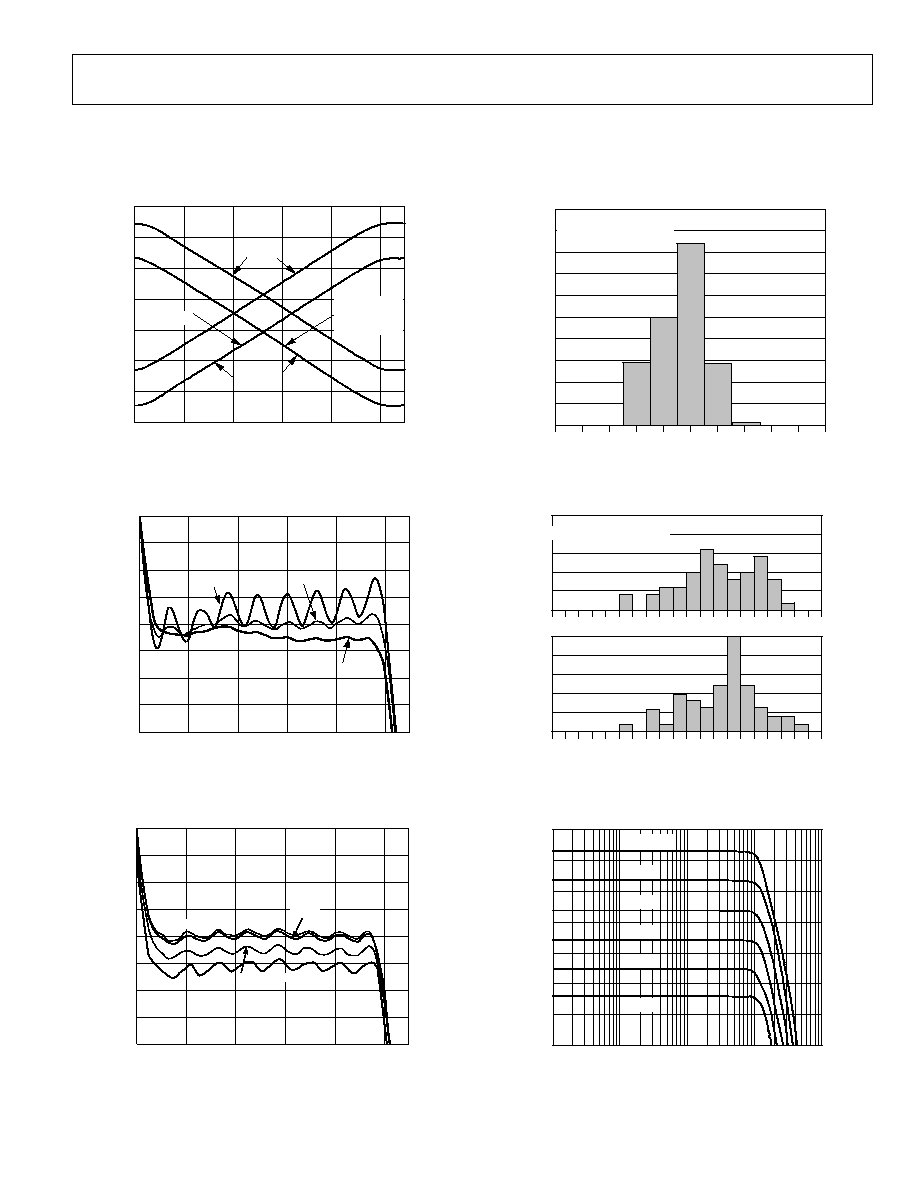
Figure 6. Gain vs. V
GAIN
and MODE (MODE Available on AC Package)
0319
9-C
-
00
4
GAIN E
RROR (dB)
0.5
1.0
2.0
1.5
0
0.2
VGAIN (V)
0.6
0.4
0
≠1.0
≠1.5
≠0.5
≠2.0
1.0
0.8
1.1
≠40∞C
+85∞C
+25∞C
Figure 7. Absolute Gain Error vs. V
GAIN
at Three Temperatures
GAIN E
RROR (dB)
0.5
1.0
2.0
1.5
0
0.2
V
GAIN
(V)
0.6
0.4
0
≠1.0
≠1.5
≠0.5
≠2.0
1.0
0.8
1.1
1MHz
30MHz
70MHz
03199-C-005
10MHz
Figure 8. Absolute Gain Error vs. V
GAIN
at Various Frequencies
0
%
O
F
U
N
I
T
S
10
20
30
40
50
≠0.1
GAIN ERROR (dB)
0.4
0
≠0.3 ≠0.2
0.1
≠0.4
≠0.5
0.3
0.2
0.5
SAMPLE SIZE = 80 UNITS
V
GAIN
= 0.5V
03199-C-006
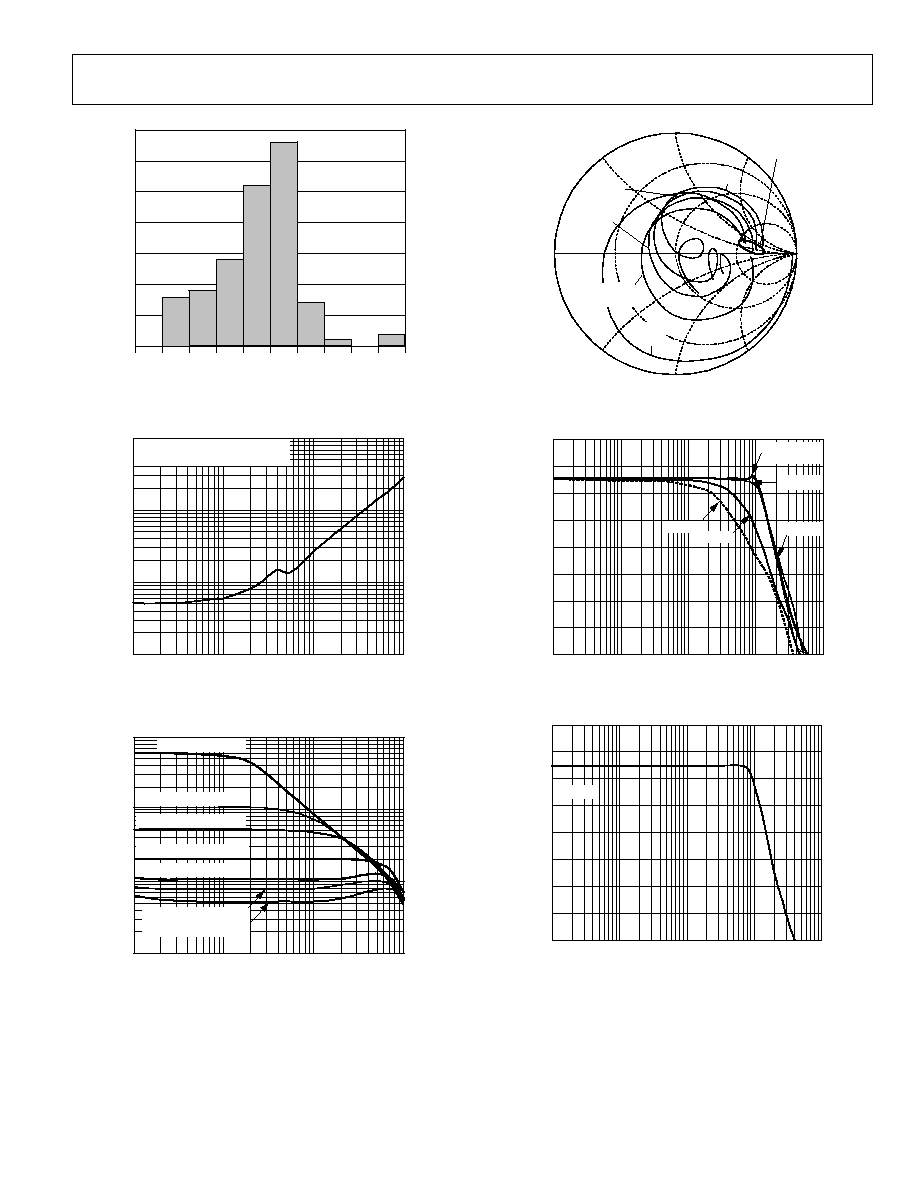
Figure 9. Gain Error Histogram
% OF UNITS
0.01
CHANNEL-TO-CHANNEL GAIN MATCH (dB)
0
0.15
0.13
0.11
0.09
0.07
0.05
0.03
≠0
.
0
1
0.21
0.19
0.17
≠0
.
1
7
≠0
.
1
5
≠0
.
1
3
≠0.11
≠0
.
0
9
≠0
.
0
7
≠0
.
0
5
≠0
.
0
3
5
25
20
15
10
0
5
25
20
15
10
V
GAIN
= 0.7V
SAMPLE SIZE = 50 UNITS
V
GAIN
= 0.2V
03199-C-007
Figure 10. Gain Match Histogram for V
GAIN
= 0.2 V and 0.7 V
G
A
I
N
(
d
B
)
≠10
0
10
20
40
30
50
100k
≠20
FREQUENCY (Hz)
1M
1G
100M
10M
V
GAIN
= 1V
0.8V
0.6V
0.4V
0.2V
0V
03199-C-008
Figure 11. Frequency Response for Various Values of V
GAIN
AD8331/AD8332
Rev. D | Page 10 of 36
FREQUENCY (Hz)
GAIN (
d
B)
≠10
0
10
20
40
30
50
60
0.8V
0.6V
0.4V
0.2V
0V
1M
1G
100k
100M
10M
03199-C-009
V
GAIN
= 1V
Figure 12. Frequency Response for Various Values of V
GAIN
, HILO = HI
GAIN (
d
B)
≠10
0
10
20
≠40
30
≠30
≠20
1M
1G
100k
100M
10M
V
GAIN
= 0.5 V
R
IN
= R
S
= 50
, 75
, 100
R
IN
= R
S
= 1k
03199-C-010
R
IN
= R
S
= 500
R
IN
= R
S
= 200
FREQUENCY (Hz)
Figure 13. Frequency Response for Various Matched Source Impedances
FREQUENCY (Hz)
G
A
I
N
(
d
B
)
≠10
0
10
20
≠40
30
≠30
≠20
1M
1G
100k
100M
10M
V
GAIN
= 0.5V
R
FB
=
03199-C-011
Figure 14. Frequency Response, Unterminated, R
S
= 50
FREQUENCY (Hz)
C
R
O
S
S
T
A
L
K
(
d
B
)
≠70
0
≠60
≠50
≠30
≠40
≠20
1M
100k
100M
10M
≠10
≠90
≠80
0.7V
0.4V
0.9V
V
GAIN
= 1V
0.5V
V
OUT
= 1 V p-p
03199-C-012
Figure 15. Channel-to-Channel Crosstalk vs.
Frequency for Various Values of V
GAIN
FREQUENCY (Hz)
1M
100k
100M
10M
0
50
45
40
35
30
25
20
15
10
5
03199-C-013
0.1
F
COUPLING
1
F
COUPLING
GROUP DELAY (
n
s)
Figure 16. Group Delay vs. Frequency
1.1
0.4
0.2
0
0.3
0.1
0.9
0.7
0.5
0.8
0.6
1.0
≠20
≠10
0
10
20
≠20
≠10
0
10
20
T = +25
∞
C
LO GAIN
T = +25
∞
C
03199-C-014
V
GAIN
(V)
OFFSET VOLTA
GE (
m
V)
HI GAIN
T = +85
∞
C
T = +85
∞
C
T = ≠40
∞
C
T = ≠40
∞
C
T = ≠40
∞
C
T = +25
∞
C
T = +85
∞
C
T = ≠40
∞
C
Figure 17. Representative Differential Output Offset Voltage vs.
V
GAIN
at Three Temperatures
AD8331/AD8332
Rev. D | Page 11 of 36
% TOTAL
50.5
GAIN SCALING FACTOR
0
50.4
49.6 49.7 49.8 49.9 50.0 50.1 50.2 50.3
5
25
20
15
10
35
SAMPLE SIZE = 100
0.2V < V
GAIN
< 0.7V
30
03199-B
-
015
Figure 18. Gain Scaling Factor Histogram
100
100k
1M
10
1
0.1
10M
100M
FREQUENCY (Hz)
O
U
T
P
U
T
I
M
P
E
D
A
N
C
E
(
)
SINGLE ENDED, PIN VOH OR VOL
R
L
=
03199-C-016
Figure 19. Output Impedance vs. Frequency
FREQUENCY (Hz)
I
N
P
U
T
I
M
P
E
D
A
N
C
E
(
)
100
1k
10
10k
1M
100k
100M
10M
R
FB
=
, C
SH
= 0pF
R
FB
= 270
, C
SH
= 22pF
R
FB
= 412
, C
SH
= 12pF
R
FB
= 549
, C
SH
= 8.2pF
R
FB
= 3.01k
, C
SH
= 0pF
R
FB
= 6.65k
, C
SH
= 0pF
R
FB
= 1.1k
, C
SH
= 1.2pF
03199-C-017
Figure 20. LNA Input Impedance vs.
Frequency for Various Values of R
FB
and C
SH
0
17
25j
≠25j
50j
≠50j
100j
≠100j
f = 100kHz
R
IN
= 50
R
FB
= 270
R
IN
= 75
,
R
FB
= 412
R
IN
= 100
,
R
FB
= 549
,
R
IN
= 200
,
R
FB
= 1.1k
R
IN
= 6k
,
R
FB
=
03199-
B
-
018
Figure 21. Smith Chart, S11 vs.
Frequency, 0.1 MHz to 200 MHz for Various Values of R
FB
1G
FREQUENCY (Hz)
10M
G
A
I
N
(
d
B
)
100k
≠10
≠5
0
5
20
10
15
100M
1M
≠20
≠15
R
IN
= 50
, 75
,
AND 100
R
IN
= 200
R
IN
= 200
R
IN
= 500
R
IN
= 1k
03199-C-019
Figure 22. LNA Frequency Response, Single-Ended, for Various Values of R
IN
1G
FREQUENCY (Hz)
10M
G
A
I
N
(
d
B
)
100k
≠10
≠5
0
5
20
10
15
100M
1M
≠20
≠15
R
FB
=
03199-C-020
Figure 23. LNA Frequency Response, Unterminated, Single-Ended
AD8331/AD8332
Rev. D | Page 12 of 36
500
0
0.4
V
GAIN
(V)
1.0
0.6
300
0
100
400
200
0.2
0.8
O
U
T
P
U
T
-
R
E
F
E
R
R
E
D
N
O
I
S
E
(
n
V
/
H
z
)
HILO = HI
f = 10MHz
HILO = LO
03199-C-021
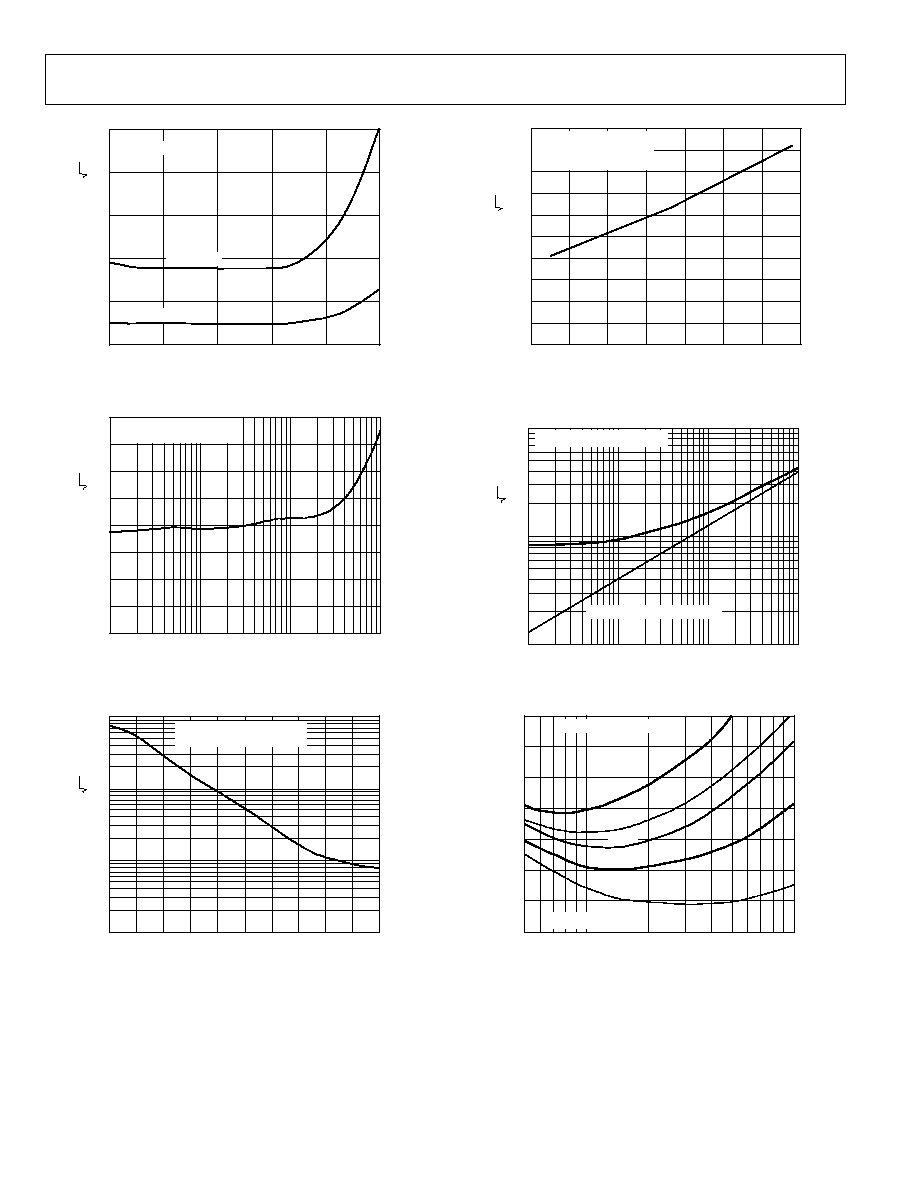
Figure 24. Output-Referred Noise vs. V
GAIN
1M
10M
0
100M
100k
FREQUENCY (Hz)
1.6
1.4
1.2
1.0
0.8
0.6
0.4
0.2
I
N
P
U
T
N
O
I
S
E
(
n
V
/
H
z
)
R
S
= 0, R
FB
=
, V
GAIN
= 1V
HILO = LO OR HI
03199-C-022
Figure 25. Short-Circuit Input-Referred Noise vs. Frequency
1
0
0.4
V
GAIN
(V)
1.0
0.6
0.1
100
10
0.2
0.8
I
N
P
U
T
N
O
I
S
E
(
n
V
/
H
z
)
R
S
= 0, R
FB
=
,
HILO = LO OR HI, f = 10MHz
03199-C-023
Figure 26. Short-Circuit Input-Referred Noise vs. V
GAIN
90
TEMPERATURE (
∞
C)
10
≠30
≠50
≠10
70
50
30
0.50
1.00
0.95
0.90
0.85
0.80
0.75
0.70
0.65
0.60
0.55
I
N
P
U
T
N
O
I
S
E
(
n
V
/
H
z
)
R
S
= 0, R
FB
=
,
V
GAIN
= 1V, f = 10MHz
03199-C-024
Figure 27. Short-Circuit Input-Referred Noise vs. Temperature
1
10
1.0
0.1
100
1k
SOURCE RESISTANCE (
)
10
I
N
P
U
T
N
O
I
S
E
(
n
V
/
H
z
)
R
S
= THERMAL NOISE ALONE
f = 5MHz, R
FB
=
, V
GAIN
= 1V
03199-C-025
Figure 28. Input-Referred Noise vs. R
S
N
O
I
S
E
F
I
G
U
R
E
(
d
B
) 5
6
7
4
2
1
3
0
100
50
1k
75
200
SOURCE RESISTANCE (
)
R
IN
= 50
R
FB
=
INCLUDES NOISE OF VGA
SIMULATION
100
03199-C-026
Figure 29. Noise Figure vs. R
S
for Various Values of R
IN
AD8331/AD8332
Rev. D | Page 13 of 36
N
O
I
S
E
F
I
G
U
R
E
(
d
B
)
40
50
0
0.2
V
GAIN
(V)
0.6
0.4
30
10
0
20
5
1.0
0.8
1.1
35
45
25
15
0.1
0.5
0.3
0.9
0.7
HILO = LO, R
IN
= 50
HILO = LO, R
FB
=
HILO = HI, R
FB
=
HILO = HI, R
IN
= 50
f = 10MHz, R
S
= 50
03199-C-027
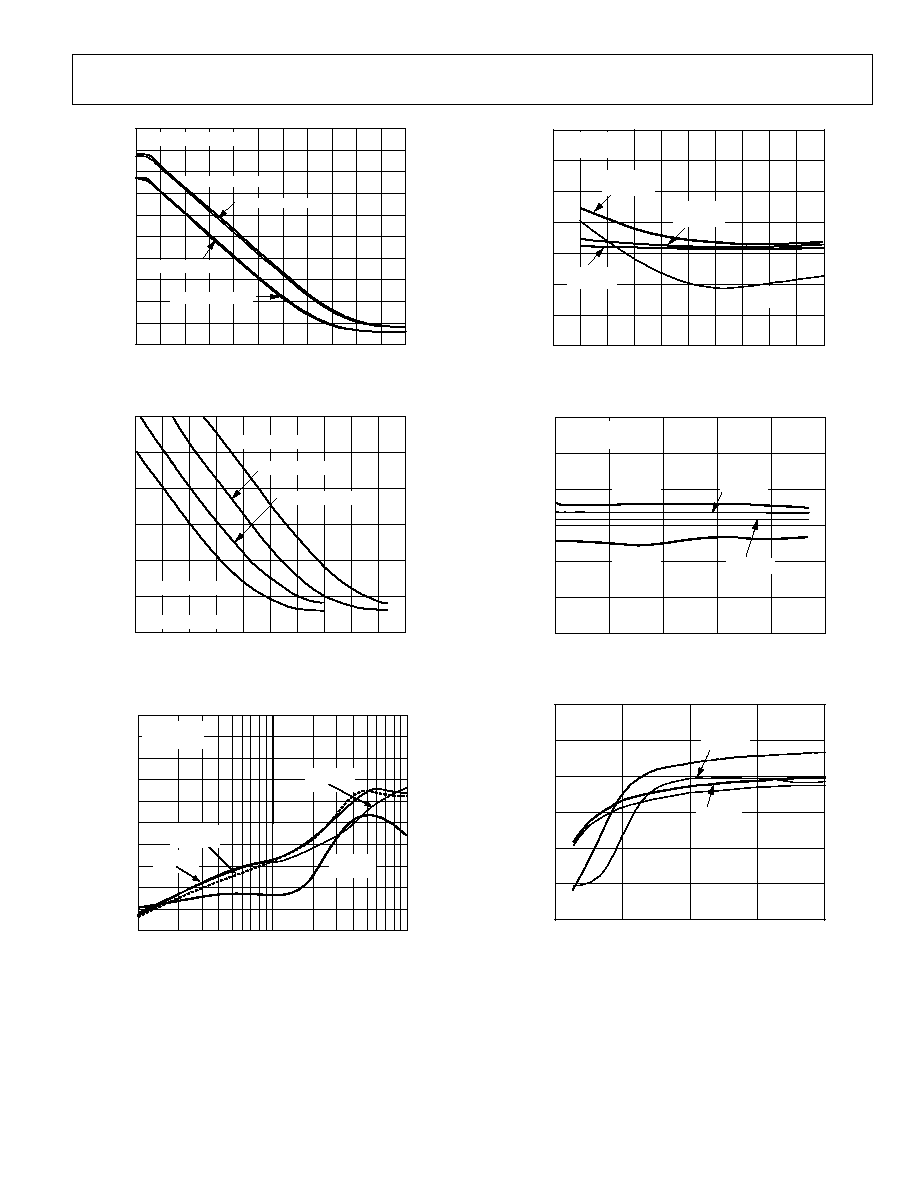
Figure 30. Noise Figure vs. V
GAIN
N
O
I
S
E
F
I
G
U
R
E
(
d
B
)
30
10
20
GAIN (dB)
35
25
20
0
5
55
45
60
25
15
10
15
30
50
40
HILO = HI, R
IN
= 50
HILO = HI, R
FB
=
HILO = LO, R
IN
= 50
HILO = LO, R
FB
=
f = 10MHz, R
S
= 50
03199-C-028
Figure 31. Noise Figure vs. Gain
HARM
O
N
I
C
DIS
T
O
R
T
I
O
N
(
d
Bc
)
≠70
≠60
≠50
≠40
≠100
≠90
≠80
100M
1M
10M
HILO = HI,
HD3
≠30
≠20
≠10
0
G = 30dB
V
OUT
= 1V
P-P
FREQUENCY (Hz)
03199-C-029
HILO = LO,
HD3
HILO = HI,
HD2
HILO = LO,
HD2
Figure 32. Harmonic Distortion vs. Frequency
H
A
R
M
O
N
I
C
D
I
S
T
O
R
T
I
O
N
(
d
B
c
)
≠70
≠60
≠50
≠40
≠100
≠90
≠80
200
800
0
600
400
1.0k
2.0k
1.8k
1.6k
1.4k
1.2k
≠30
R
LOAD
(
)
HILO = LO,
HD3
HILO = LO,
HD2
f = 10MHz
V
OUT
= 1V p-p
HILO = HI,
HD2
HILO = HI,
HD3
03199-C-030
Figure 33. Harmonic Distortion vs. R
LOAD
HARM
O
N
IC
DIS
TORTIO
N
(dBc
)
≠70
≠60
≠50
≠40
≠100
≠90
≠80
10
40
50
0
30
20
C
LOAD
(pF)
HILO = HI,
HD3
HILO = LO,
HD2
HILO = LO,
HD3
f = 10MHz
V
OUT
= 1V p-p
03199-C-031
HILO = HI,
HD2
Figure 34. Harmonic Distortion vs. C
LOAD
HAR
MONIC DISTORT
ION
(
dBc)
≠70
≠60
≠50
≠40
≠100
≠90
≠80
1
4
0
3
2
f = 10MHz
GAIN = 30 dB
V
OUT
(V p-p)
HILO = LO,
HD3
HILO = HI,
HD3
HILO = LO,
HD2
03199-C-032
HILO = HI,
HD2
Figure 35. Harmonic Distortion vs. Differential Output Voltage
AD8331/AD8332
Rev. D | Page 14 of 36
DISTORTION (
d
Bc)
0
≠100
≠80
≠60
≠40
≠20
0
≠120
V
OUT
= 1V p-p
03199-C-033
V
GAIN
(V)
0.1
0.2
0.3
0.4
0.5
0.6
0.7
0.8
0.9
1.0
HILO = LO,
HD2
HILO = HI,
HD2
HILO = LO,
HD3
HILO = HI,
HD3
INPUT RANGE
LIMITED WHEN
HILO = LO
Figure 36. Harmonic Distortion vs. V
GAIN
, f = 1 MHz
≠100
≠80
≠60
≠40
≠20
0
≠120
INPUT RANGE
LIMITED WHEN
HILO = LO
HILO = HI,
HD2
HILO = HI,
HD3
HILO = LO,
HD2
HILO = LO,
HD3
0
V
GAIN
(V)
0.1
0.2
0.3
0.4
0.5
0.6
0.7
0.8
0.9
1.0
V
OUT
= 1V p-p
03199-C-034
DISTORTION (
d
Bc)
Figure 37. Harmonic Distortion vs. V
GAIN
, f = 10 MHz
0.4
0.2
I
N
P
U
T
P
O
W
E
R
(
d
B
m
)
0
0.3
0.1
≠30
0.9
0.7
0.5
0.8
0.6
1.0
5
0
≠5
≠10
≠15
≠20
≠25
10
V
GAIN
(V)
f = 10MHz
HILO = HI
HILO = LO
03199-C-035
Figure 38. Input 1 dB Compression vs. V
GAIN
100M
FREQUENCY (Hz)
1M
I
M
D
3
(
d
B
c
)
10M
≠10
≠90
≠80
≠70
≠60
≠30
≠50
≠40
≠20
0
V
OUT
= 1V p-p COMPOSITE (f
1
+ f
2
)
G = 30dB
03199-C-036
Figure 39. IMD3 vs. Frequency
O
U
T
P
U
T
I
P
3
(
d
B
m
)
V
GAIN
(V)
15
20
25
30
0
5
10
0.1
0.4
0
0.3
0.2
1.0
0.9
0.8
0.7
0.6
0.5
40
35
HILO = HI,
1MHz
HILO = HI,
10MHz
HILO = LO,
10MHz
HILO = LO,
1MHz
V
OUT
= 1V p-p COMPOSITE (f
1
+ f
2
)
03199-C-037
Figure 40. Output Third-Order Intercept vs. V
GAIN
100
90
10
0
2mV
50mV
10ns
031
99-
C
-
0
3
8
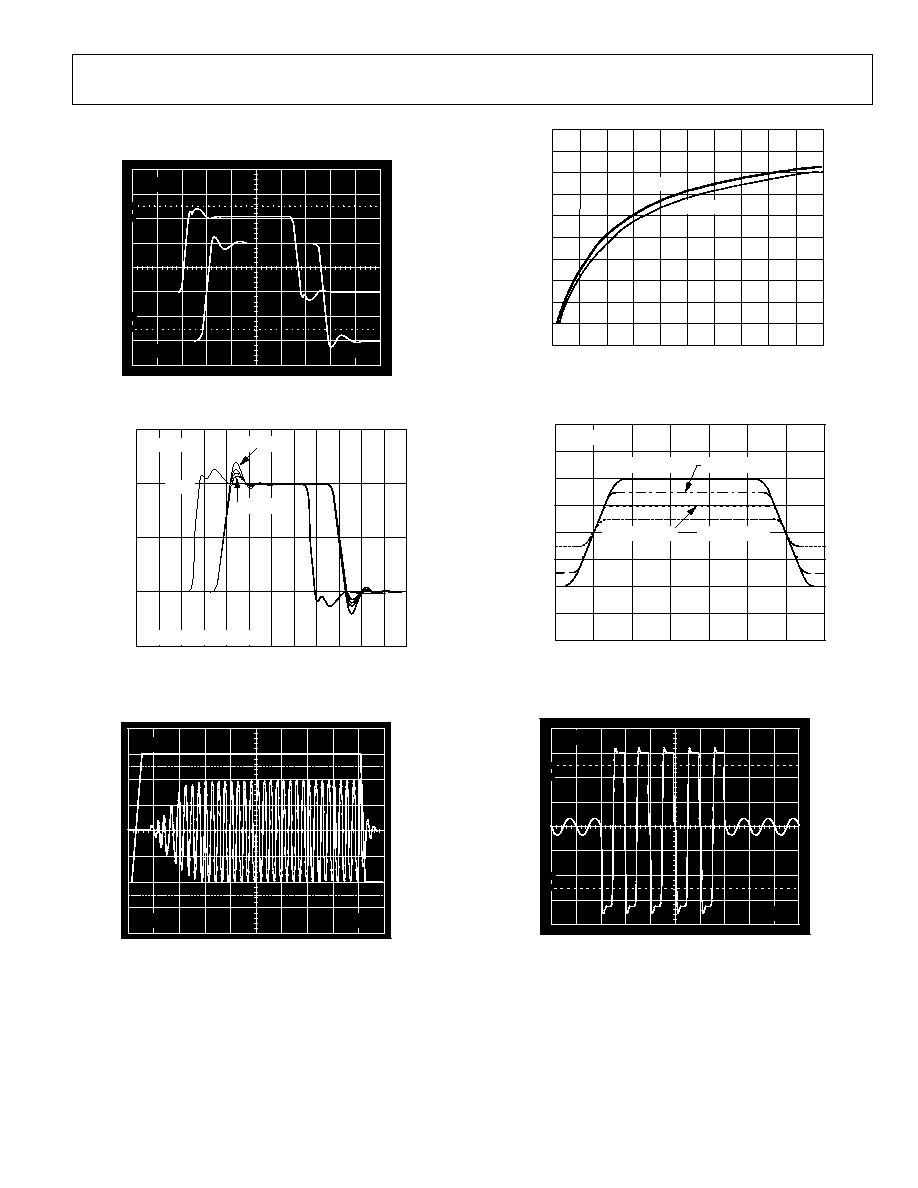
Figure 41. Small Signal Pulse Response, G = 30 dB,
Top: Input, Bottom: Output Voltage, HILO = HI or LO
AD8331/AD8332
Rev. D | Page 15 of 36
100
90
10
0
500mV
10ns
03199-C-039
20mV
Figure 42. Large Signal Pulse Response, G = 30 dB,
HILO = HI or LO, Top: Input, Bottom: Output Voltage
10
≠10
≠30
0
≠20
≠2
60
40
20
50
30
≠40
1
0
≠1
2
80
70
INPUT
03199-C-040
V
OUT
(V
)
TIME (ns)
G = 30dB
C
L
= 50pF
C
L
= 0pF
INPUT IS NOT TO SCALE
Figure 43. Large Signal Pulse Response for Various Capacitive Loads,
C
L
= 0 pF, 10 pF, 20 pF, 50 pF
400ns
200mV
500mV
03199-B
-
041
Figure 44. Pin GAIN Transient Response,
Top: V
GAIN
, Bottom: Output Voltage
V
O
U
T
(
V
p
-
p
)
0
10
30
20
50
40
1
4
3
2
0
5
R
CLMP
(k
)
HILO = LO
HILO = HI
03199-C-042
Figure 45. Clamp Level vs. R
CLMP
30
TIME (ns)
10
V
O
U
T
(
V
)
≠10
20
0
≠4
60
40
50
1
0
≠1
2
4
3
≠2
≠3
G = 40dB
R
CLMP
= 48.1k
R
CLMP
= 16.5k
R
CLMP
= 7.15k
R
CLMP
= 2.67k
03199-C-043
Figure 46. Clamp Level Pulse Response
100
90
10
0
100ns
200mV
03199-B
-
044
Figure 47. LNA Overdrive Recovery, V
INH
0.05 V p-p to 1 V p-p Burst,
V
GAIN
= 0.27 V, VGA Output Shown
AD8331/AD8332
Rev. D | Page 16 of 36
100
90
10
0
100ns
50mV
03199-B
-
045
1V
2V
1ms
03199-B
-
048
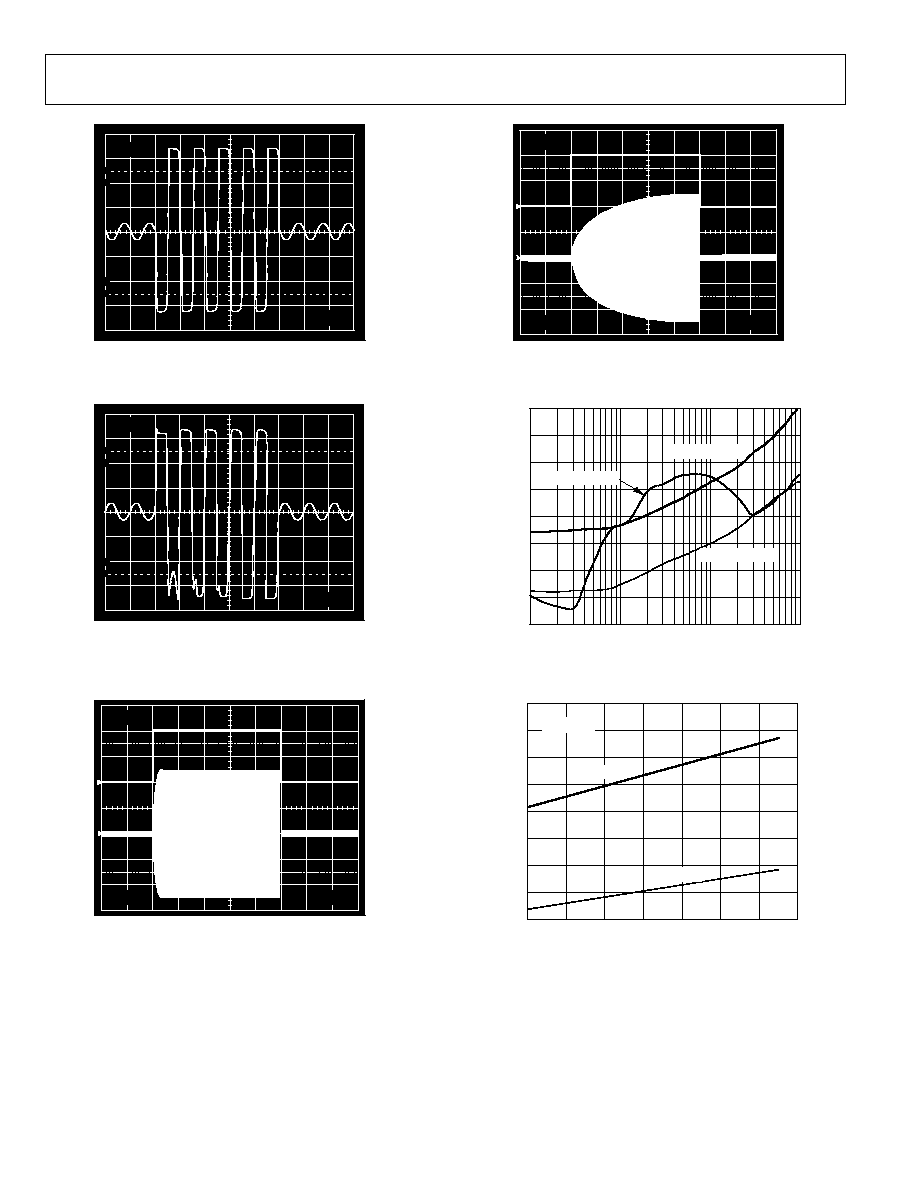
Figure 48. VGA Overdrive Recovery, V
INH
4 mV p-p to 70 mV p-p Burst,
V
GAIN
= 1 V, VGA Output Shown Attenuated 24 dB
Figure 51. Enable Response, Large Signal,
Top: V
ENB
, Bottom: V
B
OUT
, V
INH
= 150 mV p-p
100
90
10
0
100ns
50mV
03199-B
-
046
FREQUENCY (Hz)
P
S
R
R
(
d
B
)
1M
100k
100M
10M
≠80
0
≠10
≠20
≠30
≠40
≠50
≠60
≠70
VPS1, V
GAIN
= 0.5V
VPS1, V
GAIN
= 0V
VPSV, V
GAIN
= 0.5V
03199-C-049
Figure 52. PSRR vs. Frequency (No Bypass Capacitor)
Figure 49. VGA Overdrive Recovery, V
INH
4 mV p-p to 275 mV p-p Burst,
V
GAIN
= 1 V, VGA Output Shown Attenuated 24 dB
1ms
200mV
2V
03199-B
-
047
40
0
≠40
40
45
50
55
60
20
≠20
30
100
80
60
20
25
35
03199-C-050
TEMPERATURE (
∞
C)
AD8331
AD8332
V
GAIN
= 0.5V
QU
IESC
EN
T SU
PPLY C
U
R
R
E
N
T
(
m
A
)
Figure 50. Enable Response, Top: V
ENB
, Bottom: V
B
OUT
, V
INH
= 30 mV p-p
Figure 53. Quiescent Supply Current vs. Temperature
AD8331/AD8332
Rev. D | Page 17 of 36
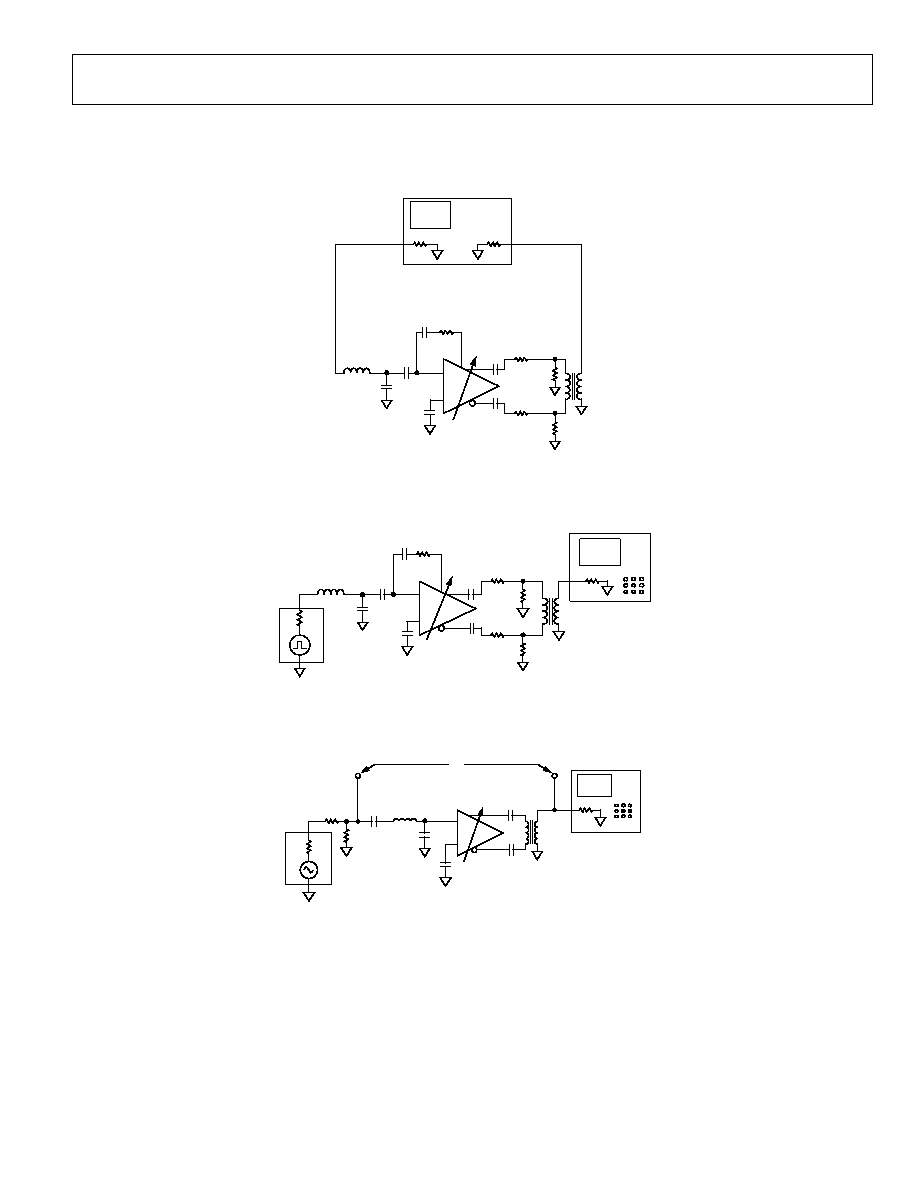
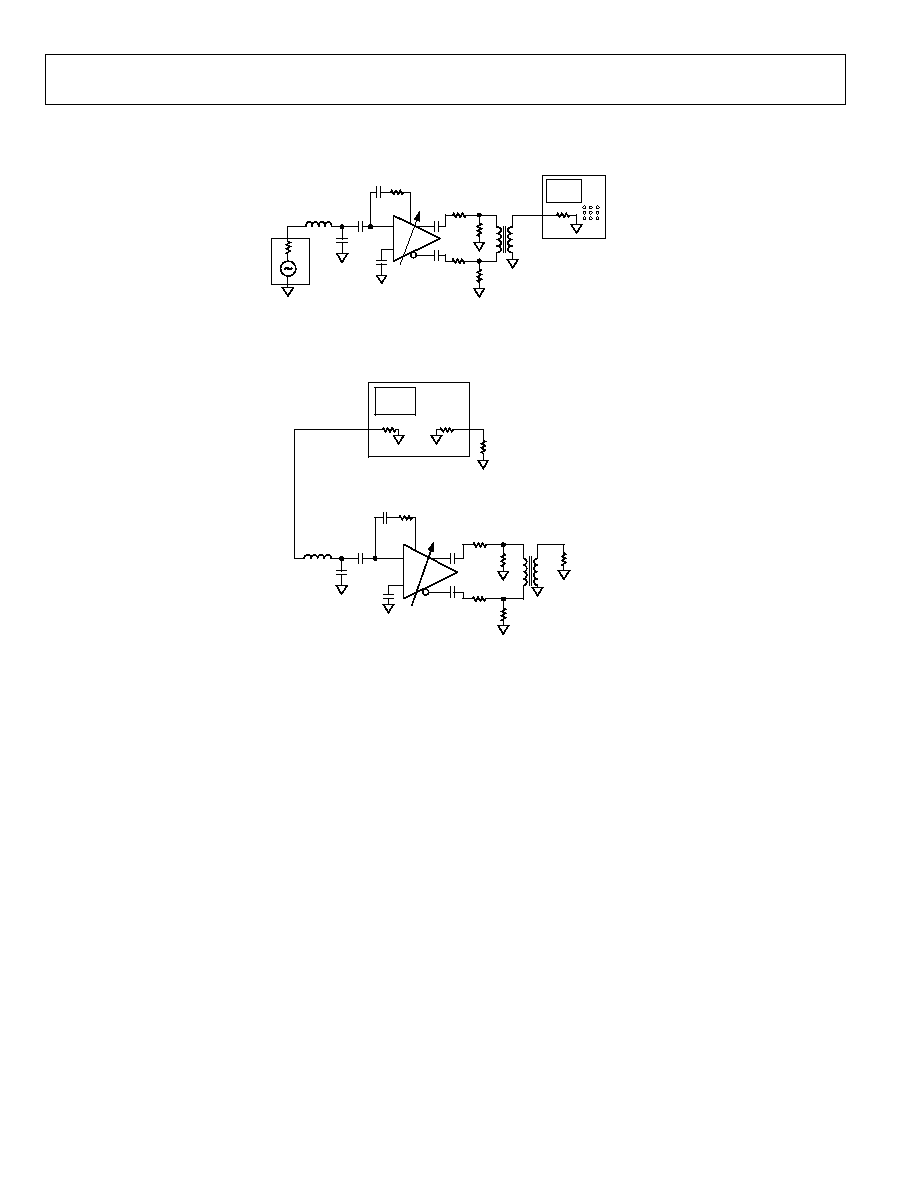
TEST CIRCUITS
LMD
1.8nF
22pF
FB*
120nH
IN
OUT
0.1
F
DUT
03199-C-051
*FERRITE BEAD
NETWORK ANALYZER
0.1
F
28
237
28
1:1
50
50
0.1
F
270
INH
237
0.1
F
Figure 54. Gain and Bandwidth Measurements
1:1
IN
LMD
DUT
0.1
F
22pF
FB*
120nH
0.1
F
03199-C-052
*FERRITE BEAD
50
0.1
F
INH
0.1
F
28
237
237
28
50
1.8nF270
OSCILLOSCOPE
Figure 55. Transient Measurements
1:1
LMD
INH
DUT
0.1
F
SPECTRUM
ANALYZER
IN
22pF
1
49
50
A
B
G
*FERRITE BEAD
FB*
120nH
0.1
F
0.1
F
50
03199-C-053
0.1
F
Figure 56. Used for Noise Measurements
AD8331/AD8332
Rev. D | Page 18 of 36
IN
50
0.1
F
28
03199-C-054
28
0.1
F
0.1
F
0.1
F
50
SPECTRUM
ANALYZER
120nH
FB*
22pF
LMD
INH
DUT
1:1
1.8nF 270
237
237
*FERRITE BEAD
Figure 57. Distortion
270
1:1
NETWORK ANALYZER
LMD
INH
DUT
1.8nF
0.1
F
22pF
FB*
120nH
50
IN
OUT
*FERRITE BEAD
28
237
50
50
0.1
F
0.1
F
0.1
F
237
28
50
03
199-
C-
055
Figure 58. S11 Measurements
AD8331/AD8332
Rev. D | Page 19 of 36
THEORY OF OPERATION
OVERVIEW
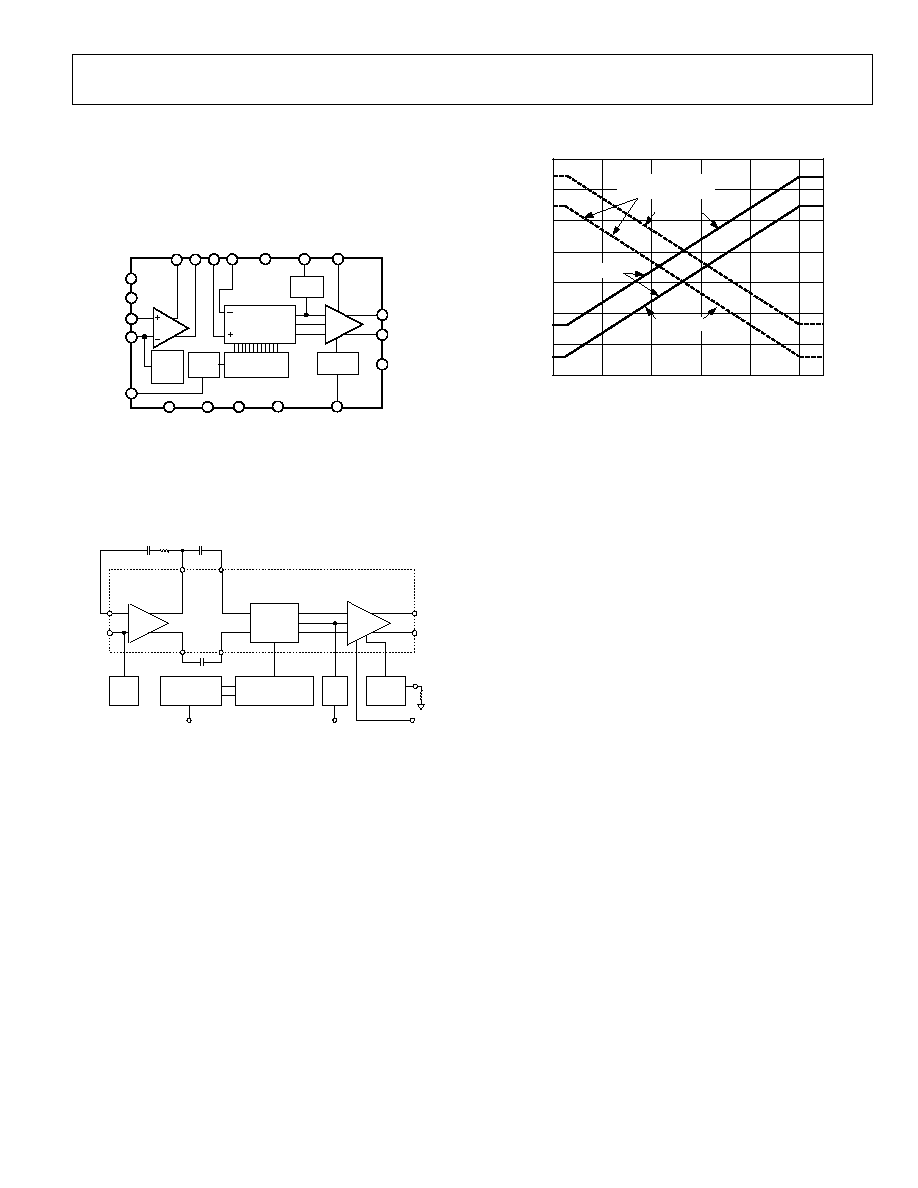
The following discussion applies to all part numbers. Figure 59
and Figure 1 are functional block diagrams of the AD8331 and
AD8332, respectively.
LNA
2
1
6
3
LMD
INH
COML
VPSL
10
GAIN
COMM
LNA
BIAS
(V
MID
)
VGA
G = ≠48dB to 0dB
+21dB
BIAS AND
INTERPOLATOR
20
4
5
7
8
17
19
18
V
MID
POST
AMP1
12
CLAMP
GAIN
INT
11
13
15
16
9
3.5dB/
15.5dB
ENBL
ENBV
RCLMP
VOH
VOL
MODE
LON LOP VIP VIN
VPOS
VCM
14
HILO
COMM
AD8331
03199-C-056
Figure 59. Functional Block Diagram--AD8331
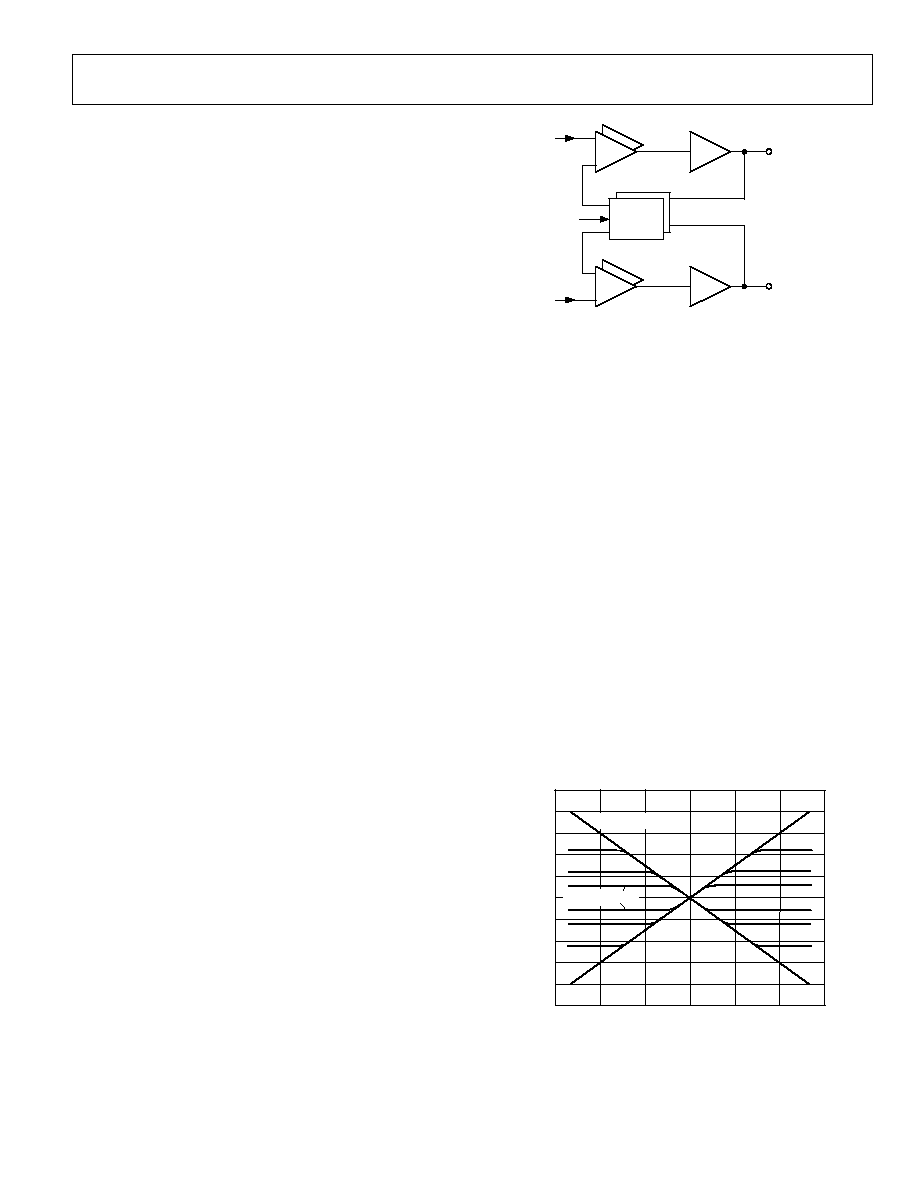
Each channel contains an LNA that provides user-adjustable
input impedance termination, a differential X-AMP VGA,
and a programmable gain postamplifier with adjustable output
voltage limiting. Figure 60 shows a simplified block diagram.
VOL
VOH
LNA
CLAMP*
≠
+
INH
LMD
LOP
LON
HILO
VCM
PREAMPLIFIER
19dB
X-AMP VGA
POSTAMP
[(≠48 to 0) + 21] dB
3.5dB/15.5dB
GAIN
INTERFACE*
GAIN
BIAS AND
INTERPOLATOR*
VIN
VIP
*SHARED BETWEEN CHANNELS
RCLMP
BIAS
(V
MID
)
V
MID
03199-
B
-
057
Figure 60. Simplified Block Diagram
The linear-in-dB gain control interface is trimmed for slope and
absolute accuracy. The overall gain range is 48 dB, extending
from -4.5 dB to +43.5 dB or from +7.5 dB to +55.5 dB,
depending on the setting of the HILO pin. The slope of the gain
control interface is 50 dB/V, and the gain control range is
40 mV to 1 V, leading to the following expressions for gain:
GAIN (dB) = 50 (dB/V) ◊ V
GAIN
- 6.5 dB, (HILO = LO) (1)
or
GAIN (dB) = 50 (dB/V) ◊ V
GAIN
+ 5.5 dB, (HILO = LO) (2)
The gain characteristics are shown in Figure 61.
G
A
IN (
d
B)
40
50
0
0.2
V
GAIN
(V)
0.6
0.4
30
10
0
20
≠10
1.0
0.8
1.1
60
HILO = HI
HILO = LO
MODE = LO
MODE = HI
(WHERE AVAILABLE)
03199-C-058
Figure 61. Gain Control Characteristics
When MODE is set high (where available):
GAIN (dB) = -50 (dB/V) ◊ V
GAIN
+ 45.5 dB, (HILO = LO) (3)
or
GAIN (dB) = -50 (dB/V) ◊ V
GAIN
+ 57.5 dB, (HILO = HI) (4)
The LNA converts a single-ended input to a differential output
with a voltage gain of 19 dB. When only one output is used, the
gain is 13 dB. The inverting output is used for active input
impedance termination. Each of the LNA outputs is capacitively
coupled to a VGA input. The VGA consists of an attenuator
with a range of 48 dB followed by an amplifier with 21 dB of
gain, for a net gain range of -27 dB to +21 dB. The X-AMP
gain-interpolation technique results in low gain error and
uniform bandwidth, and differential signal paths minimize
distortion.
The final stage is a logic-programmable amplifier with gains of
3.5 dB or 15.5 dB. The LO and HI gain modes are optimized for
12-bit and 10-bit ADC applications, in terms of output-referred
noise and absolute gain range. Output voltage limiting can be
programmed by the user.
LOW NOISE AMPLIFIER (LNA)
Good noise performance relies on a proprietary ultralow noise
preamplifier at the beginning of the signal chain, which minimizes
the noise contribution in the following VGA. Active impedance
control optimizes noise performance for applications that
benefit from input matching.
AD8331/AD8332
Rev. D | Page 20 of 36
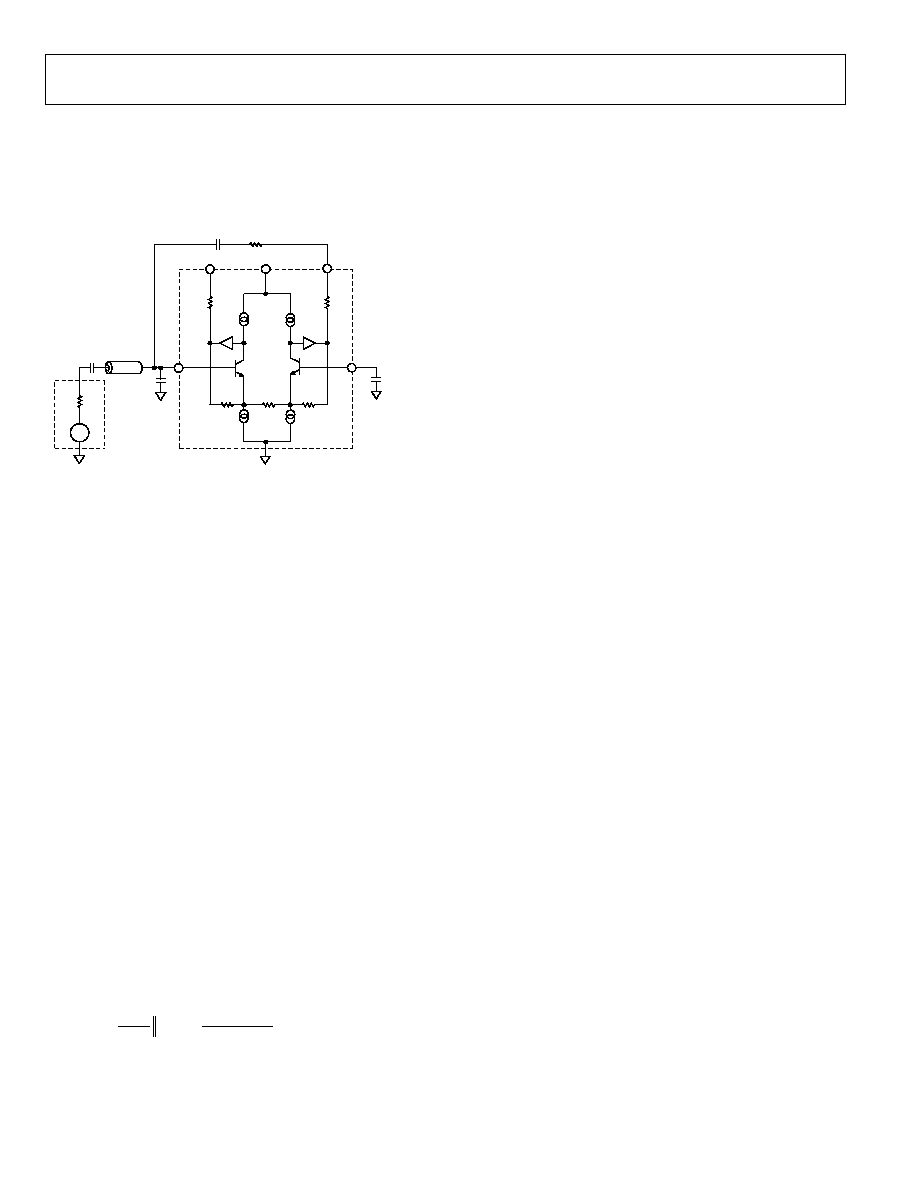
A simplified schematic of the LNA is shown in Figure 62. INH
is capacitively coupled to the source. An on-chip bias generator
centers the output dc levels at 2.5 V and the input voltages at
3.25 V. A capacitor C
LMD
of the same value as the input coupling
capacitor C
INH
is connected from the LMD pin to ground.
VPOS
INH
LOP
LMD
LON
R
S
C
INH
Q1
Q2
I
0
C
LMD
C
SH
R
FB
C
FB
03199-
C-
0
5
9
I
0
I
0
I
0
Figure 62. Simplified LNA Schematic
The LNA supports differential output voltages as high as 5 V p-p
with positive and negative excursions of ±1.25 V, about a
common-mode voltage of 2.5 V. Because the differential gain
magnitude is 9, the maximum input signal before saturation is
±275 mV or 550 mV p-p. Overload protection ensures a quick
recovery time from large input voltages. Because the inputs are
capacitively coupled to a bias voltage near midsupply, very large
inputs can be handled without interacting with the ESD
protection.
Low value feedback resistors and the current-driving capability
of the output stage allow the LNA to achieve a low input-
referred voltage noise of 0.74 nV/Hz. This is achieved with a
modest current consumption of 10 mA per channel (50 mW).
On-chip resistor matching results in precise gains of 4.5 per side
(9 differential), critical for accurate impedance control. The use
of a fully differential topology and negative feedback minimizes
distortion. Low HD2 is particularly important in second
harmonic ultrasound imaging applications. Differential
signaling enables smaller swings at each output, further
reducing third-order distortion.
Active Impedance Matching
The LNA supports active impedance matching through an
external shunt feedback resistor from Pin LON to Pin INH.
The input resistance R
IN
is given by Equation 5, where A is the
single-ended gain of 4.5, and 6 k is the unterminated input
impedance.
FB
FB
FB
IN
R
R
A
R
R
+
◊
=
+
=
k
33
k
6
k
6
1
(5)
C
FB
is needed in series with R
FB
, because the dc levels at Pin LON
and Pin INH are unequal. Expressions for choosing R
FB
in
terms of R
IN
and for choosing C
FB
are found in the Applications
section. C
SH
and the ferrite bead enhance stability at higher
frequencies where the loop gain declines and prevents peaking.
Frequency response plots of the LNA are shown in Figure 22
and Figure 23. The bandwidth is approximately 130 MHz for
matched input impedances of 50 to 200 and declines at
higher source impedances. The unterminated bandwidth
(R
FB
= ) is approximately 80 MHz.
Each output can drive external loads as low as 100 in addition
to the 100 input impedance of the VGA (200 differential).
Capacitive loading up to 10 pF is permissible. All loads should
be ac-coupled. Typically, Pin LOP output is used as a single-
ended driver for auxiliary circuits, such as those used for
Doppler mode ultrasound imaging, and Pin LON drives R
FB
.
Alternatively, a differential external circuit can be driven from
the two outputs, in addition to the active feedback termination.
In both cases, important stability considerations discussed in
the Applications section should be carefully observed.
The impedance at each LNA output is 5 . A 0.4 dB reduction
in open-circuit gain results when driving the VGA, and 0.8 dB
with an additional 100 load at the output. The differential
gain of the LNA is 6 dB higher. If the load is less than 200 on
either side, a compensating load is recommended on the
opposite output.
LNA Noise
The input-referred voltage noise sets an important limit on
system performance. The short-circuit input voltage noise of
the LNA is 0.74 nV/Hz or 0.82 nV/Hz (at maximum gain),
including the VGA noise. The open-circuit current noise is
2.5 pA/Hz. These measurements, taken without a feedback
resistor, provide the basis for calculating the input noise and
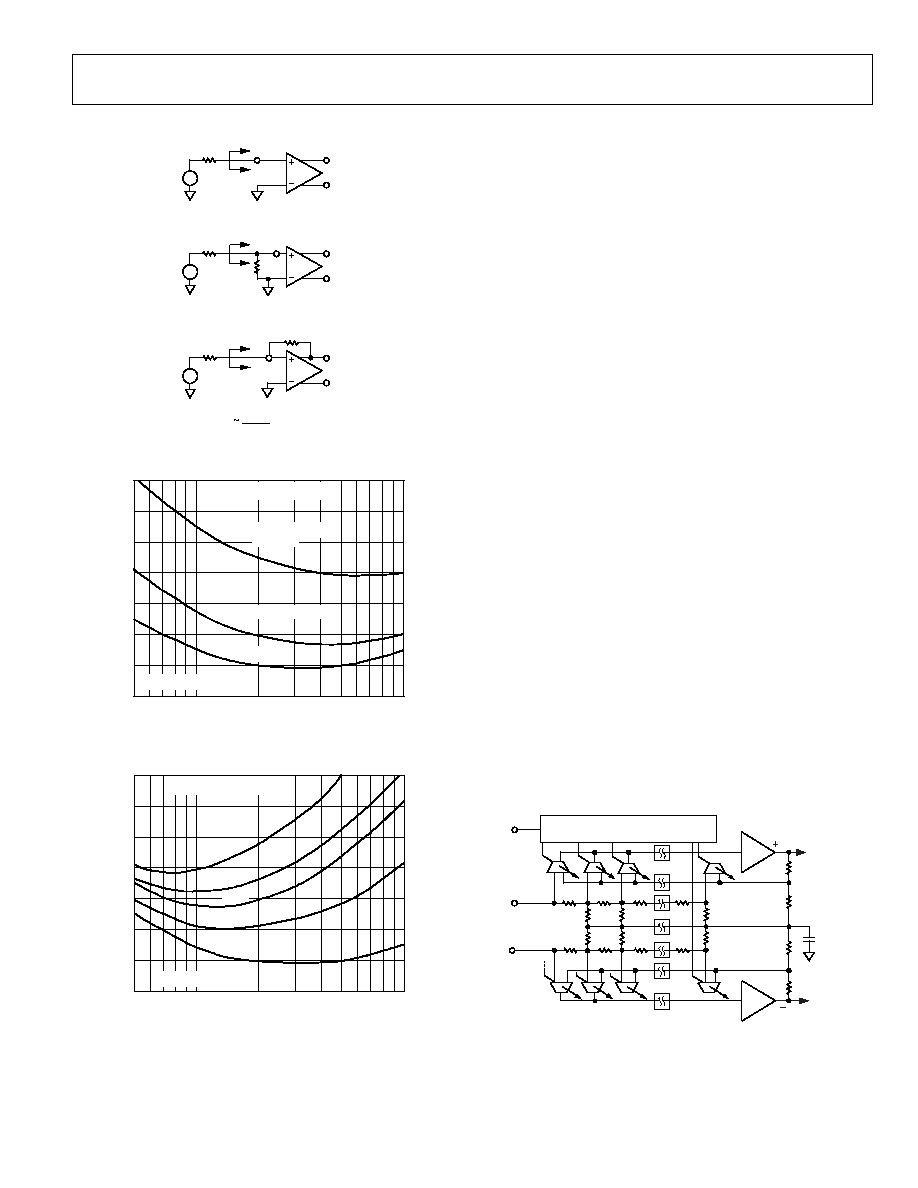
noise figure performance of the configurations in Figure 63.
Figure 64 and Figure 65 are simulations extracted from these
results, and the 4.1 dB NF measurement with the input actively
matched to a 50 source. Unterminated (R
FB
= ) operation
exhibits the lowest equivalent input noise and noise figure.
Figure 64 shows the noise figure vs. source resistance, rising at
low R
S
, where the LNA voltage noise is large compared to the
source noise, and again at high R
S
due to current noise. The
VGA's input-referred voltage noise of 2.7 nV/Hz is included in
all of the curves.
AD8331/AD8332
Rev. D | Page 21 of 36
V
OUT
UNTERMINATED
+
≠
V
IN
R
IN
R
S
V
OUT
RESISTIVE TERMINATION
+
≠
V
IN
R
IN
R
S
R
S
V
OUT
ACTIVE IMPEDANCE MATCH ≠R
S
= R
IN
+
≠
V
IN
R
IN
R
FB
R
FB
1 + 4.5
R
S
R
IN
=
03199-C-060
Figure 63. Input Configurations
NOIS
E FIGURE
(dB)
5
6
7
4
2
1
3
0
100
50
1k
R
S
(
)
ACTIVE IMPEDANCE MATCH
RESISTIVE TERMINATION
(R
S
= R
IN
)
UNTERMINATED
SIMULATION
INCLUDES NOISE OF VGA
03199-C-061
Figure 64. Noise Figure vs. R
S
for
Resistive, Active Matched, and Unterminated Inputs
NOI
S
E
FIGURE
(dB)
5
6
7
4
2
1
3
0
100
50
1k
R
IN
= 50
70
R
FB
=
R
S
(
)
200
INCLUDES NOISE OF VGA
100
SIMULATION
03199-C-081
Figure 65. Noise Figure vs. R
S
for Various Fixed Values of R
IN
, Actively Matched
The primary purpose of input impedance matching is to
improve the system transient response. With resistive termination,
the input noise increases due to the thermal noise of the
matching resistor and the increased contribution of the LNA's
input voltage noise generator. With active impedance matching,
however, the contributions of both are smaller than they would
be for resistive termination by a factor of 1/(1 + LNA Gain).
Figure 64 shows their relative noise figure (NF) performance. In
this graph, the input impedance was swept with R
S
to preserve
the match at each point. The noise figures for a source
impedance of 50 are 7.1 dB, 4.1 dB, and 2.5 dB, respectively,
for the resistive, active, and unterminated configurations. The
noise figures for 200 are 4.6 dB, 2.0 dB, and 1.0 dB,
respectively.
Figure 65 is a plot of the NF vs. R
S
for various values of R
IN
,
which is helpful for design purposes. The plateau in the NF for
actively matched inputs mitigates source impedance variations.
For comparison purposes, a preamp with a gain of 19 dB and
noise spectral density of 1.0 nV/Hz, combined with a VGA
with 3.75 nV/Hz, would yield a noise figure degradation of
approximately 1.5 dB (for most input impedances), significantly
worse than the AD8332 performance.
The equivalent input noise of the LNA is the same for single-
ended and differential output applications. The LNA noise
figure improves to 3.5 dB at 50 without VGA noise, but this is
exclusive of noise contributions from other external circuits
connected to LOP. A series output resistor is usually recommended
for stability purposes, when driving external circuits on a
separate board (see the Applications section). In low noise
applications, a ferrite bead is even more desirable.
VARIABLE GAIN AMPLIFIER
The differential X-AMP VGA provides precise input attenuation
and interpolation. It has a low input-referred noise of 2.7 nV/Hz
and excellent gain linearity. A simplified block diagram is
shown in Figure 66.
GAIN INTERPOLATOR
(BOTH CHANNELS)
POSTAMP
VIP
GAIN
R
6dB
2R
48dB
VIN
g
m
03199-C-063
POSTAMP
Figure 66. Simplified VGA Schematic

AD8331/AD8332
Rev. D | Page 22 of 36
X-AMP VGA
The input of the VGA is a differential R-2R ladder attenuator
network, with 6 dB steps per stage and a net input impedance of
200 differential. The ladder is driven by a fully differential
input signal from the LNA and is not intended for single-ended
operation. LNA outputs are ac-coupled to reduce offset and
isolate their common-mode voltage. The VGA inputs are biased
through the ladder's center tap connection to VCM, which is
typically set to 2.5 V and is bypassed externally to provide a
clean ac ground.
The signal level at successive stages in the input attenuator falls
from 0 dB to -48 dB, in 6 dB steps. The input stages of the
X-AMP are distributed along the ladder, and a biasing interpolator,
controlled by the gain interface, determines the input tap point.
With overlapping bias currents, signals from successive taps
merge to provide a smooth attenuation range from 0 dB to
-48 dB. This circuit technique results in excellent, linear-in-dB
gain law conformance and low distortion levels and deviates
±0.2 dB or less from ideal. The gain slope is monotonic with
respect to the control voltage and is stable with variations in
process, temperature, and supply.
The X-AMP inputs are part of a gain-of-12 feedback amplifier,
which completes the VGA. Its bandwidth is 150 MHz. The
input stage is designed to reduce feedthrough to the output and
ensure excellent frequency response uniformity across gain
setting (see Figure 11 and Figure 12).
Gain Control
Position along the VGA attenuator is controlled by a single-
ended analog control voltage, V
GAIN
, with an input range of
40 mV to 1.0 V. The gain control scaling is trimmed to a slope of
50 dB/V (20 mV/dB). Values of V
GAIN
beyond the control range
saturate to minimum or maximum gain values. Both channels
of the AD8332 are controlled from a single gain interface to
preserve matching. Gain can be calculated using Equation 1 and
Equation 2.
Gain accuracy is very good because both the scaling factor and
absolute gain are factory trimmed. The overall accuracy relative
to the theoretical gain expression is ±1 dB for variations in
temperature, process, supply voltage, interpolator gain ripple,
trim errors, and tester limits. The gain error relative to a best-fit
line for a given set of conditions is typically ±0.2 dB. Gain
matching between channels is better than 0.1 dB (see Figure 10,
which shows gain errors in the center of the control range). When
V
GAIN
< 0.1 or > 0.95, gain errors are slightly greater.
The gain slope can be inverted, as shown in Figure 61 (avail-
able in most versions). The gain drops with a slope of ≠50 dB/V
across the gain control range from maximum to minimum gain.
This slope is useful in applications, such as automatic gain
control, where the control voltage is proportional to the
measured output signal amplitude. The inverse gain mode is
selected by setting the MODE pin HI.
Gain control response time is less than 750 ns to settle within 10%
of the final value for a change from minimum to maximum gain.
VGA Noise
In a typical application, a VGA compresses a wide dynamic
range input signal to within the input span of an ADC. While
the input-referred noise of the LNA limits the minimum
resolvable input signal, the output-referred noise, which depends
primarily on the VGA, limits the maximum instantaneous
dynamic range that can be processed at any one particular
gain control voltage. This limit is set in accordance with the
quantization noise floor of the ADC.
Output- and input-referred noise as a function of V
GAIN
are plotted
in Figure 24 and Figure 26 for the short-circuited input condition.
The input noise voltage is simply equal to the output noise
divided by the measured gain at each point in the control range.
The output-referred noise is flat over most of the gain range,
because it is dominated by the fixed output-referred noise of the
VGA. Values are 48 nV/Hz in LO gain mode and 178 nV/Hz
in HI gain mode. At the high end of the gain control range, the
noise of the LNA and source prevail. The input-referred noise
reaches its minimum value near the maximum gain control
voltage, where the input-referred contribution of the VGA
becomes very small.
At lower gains, the input-referred noise, and thus noise figure,
increases as the gain decreases. The instantaneous dynamic
range of the system is not lost, however, because the input
capacity increases with it. The contribution of the ADC noise
floor has the same dependence as well. The important
relationship is the magnitude of the VGA output noise floor
relative to that of the ADC.
With its low output-referred noise levels, these devices ideally
drive low voltage ADCs. The converter noise floor drops 12 dB
for every 2 bits of resolution and drops at lower input full-scale
voltages and higher sampling rates. ADC quantization noise is
discussed in the Applications section.
The preceding noise performance discussion applies to a
differential VGA output signal. Although the LNA noise
performance is the same in single-ended and differential
applications, the VGA performance is not. The noise of the
VGA is significantly higher in single-ended usage, because
the contribution of its bias noise is designed to cancel in the
differential signal. A transformer can be used with single-ended
applications when low noise is desired.
AD8331/AD8332
Rev. D | Page 23 of 36
Gain control noise is a concern in very low noise applications.
Thermal noise in the gain control interface can modulate the
channel gain. The resultant noise is proportional to the output
signal level and usually only evident when a large signal is
present. Its effect is observable only in LO gain mode, where the
noise floor is substantially lower. The gain interface includes an
on-chip noise filter, which reduces this effect significantly at
frequencies above 5 MHz. Care should be taken to minimize
noise impinging at the GAIN input. An external RC filter can
be used to remove V
GAIN
source noise. The filter bandwidth
should be sufficient to accommodate the desired control
bandwidth.
Common-Mode Biasing
An internal bias network connected to a midsupply voltage
establishes common-mode voltages in the VGA and postamp.
An externally bypassed buffer maintains the voltage. The bypass
capacitors form an important ac ground connection, because
the VCM network makes a number of important connections
internally, including the center tap of the VGA's differential
input attenuator, the feedback network of the VGA's fixed gain
amplifier, and the feedback network of the postamplifier in both
gain settings. For best results, use a 1 nF and a 0.1 F capacitor
in parallel, with the 1 nF nearest to Pin VCM. Separate VCM
pins are provided for each channel. For dc-coupling to a 3 V
ADC, the output common-mode voltage is adjusted to 1.5 V by
biasing the VCM pin.
POSTAMPLIFIER
The final stage has a selectable gain of 3.5 dB or 15.5 dB, set by
the logic pin, HILO. These correspond to linear gains of 1.5 or
6. A simplified block diagram of the postamplifier is shown in
Figure 67.
Separate feedback attenuators implement the two gain settings.
These are selected in conjunction with an appropriately scaled
input stage to maintain a constant 3 dB bandwidth between the
two gain modes (~150 MHz). The slew rate is 1200 V/s in HI
gain mode and 300 V/s in LO gain mode. The feedback
networks for HI and LO gain modes are factory trimmed to
adjust the absolute gains of each channel.
Noise
The topology of the postamplifier provides constant input-
referred noise with the two gain settings and variable output-
referred noise. The output-referred noise in HI gain mode
increases (with gain) by four. This setting is recommended
when driving converters with higher noise floors. The extra gain
boosts the output signal levels and noise floor appropriately. When
driving circuits with lower input noise floors, the LO gain mode
optimizes the output dynamic range.
Gm2
+
≠
Gm1
VOH
VOL
VCM
Gm1
Gm2
F1
F2
03199-B
-
064
Figure 67. Postamplifier Block Diagram
Although the quantization noise floor of an ADC depends on a
number of factors, the 48 nV/Hz and 178 nV/Hz levels are
well suited to the average requirements of most 12-bit and 10-
bit converters, respectively. An additional technique, described
in the Applications section, can extend the noise floor even
lower for possible use with 14-bit ADCs.
Output Clamping
Outputs are internally limited to a level of 4.5 V p-p differential
when operating at a 2.5 V common-mode voltage. The postamp
implements an optional output clamp engaged through a resistor
from the RCLMP pin to ground. Table 7 shows a list of
recommended resistor values.
Output clamping can be used for ADC input overload
protection, if needed, or postamp overload protection when
operating from a lower common-mode level, such as 1.5 V. The
user should be aware that distortion products increase as output
levels approach the clamping levels and should adjust the clamp
resistor accordingly. Also, see the Applications section.
The accuracy of the clamping levels is approximately ±5% in LO
or HI mode. Figure 68 illustrates the output characteristics for a
few values of R
CLMP
.
≠3
≠2
V
INH
(V)
V
OH
, V
OL
(V
)
0
≠1
0.5
2
1
3
1.0
4.5
4.0
3.5
3.0
2.5
2.0
1.5
0
5.0
8.8k
3.5k
R
CLMP
=
R
CLMP
= 1.86k
03199-C-065
Figure 68. Output Clamping Characteristics
AD8331/AD8332
Rev. D | Page 24 of 36
APPLICATIONS
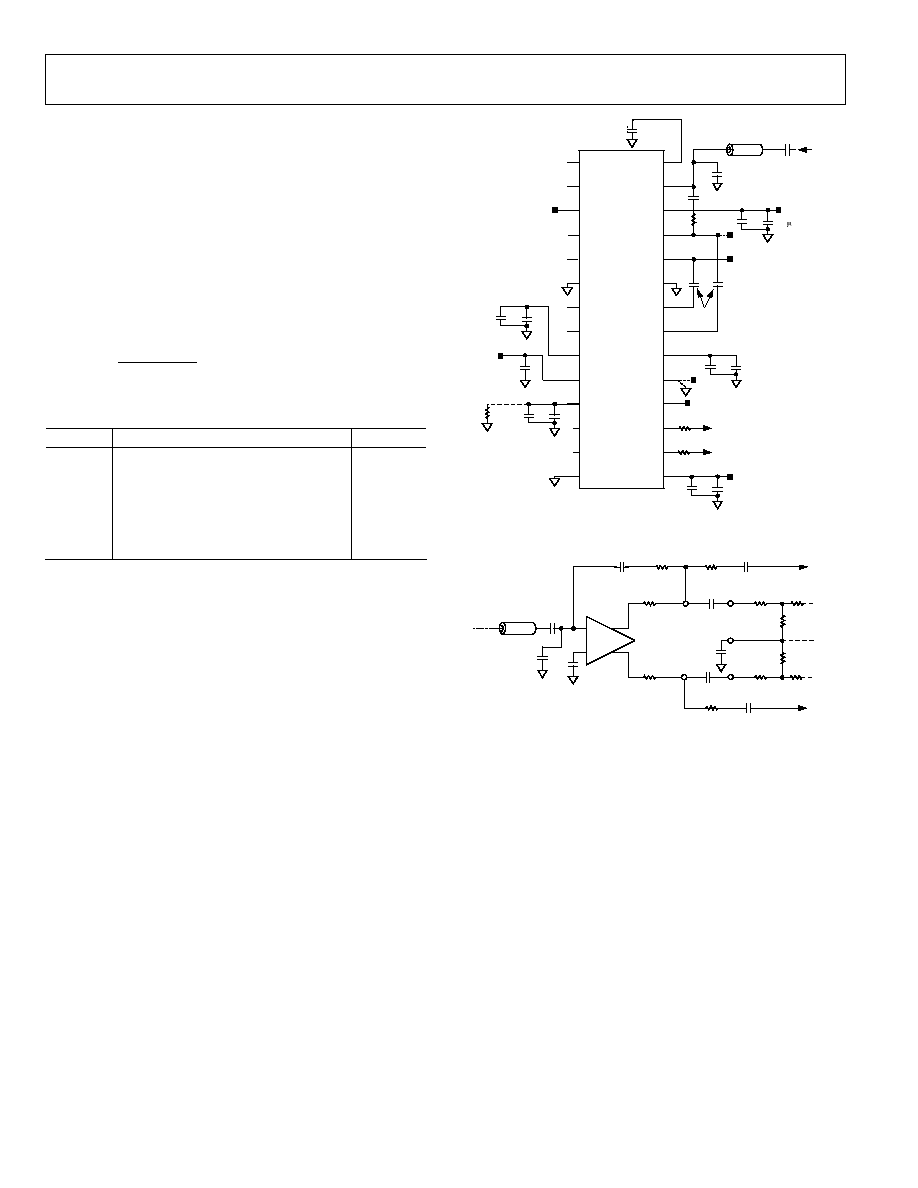
LNA--EXTERNAL COMPONENTS
The LMD pin (connected to the bias circuitry) must be
bypassed to ground and signal sourced to the INH pin
capacitively coupled using 2.2 nF to 0.1 F capacitors (see
Figure 69).
The unterminated input impedance of the LNA is 6 k. The
user can synthesize any LNA input resistance between 50 and
6 k. R
FB
is calculated according to Equation 6 or selected from
Table 6.
( )
( )
IN
IN
FB
R
R
R
≠
k
6
k
33
◊
=
(6)
Table 6. LNA External Component Values for Common
Source Impedances
R
IN
()
R
FB
(Nearest STD 1% Value, )
C
SH
(pF)
50 280
22
75 412
12
100 562
8
200 1.13
k
1.2
500 3.01
k
None
6 k
None
When active input termination is used, a 0.1 F capacitor (C
FB
) is
required to isolate the input and output bias voltages of the LNA.
The shunt input capacitor, C
SH
, reduces gain peaking at higher
frequencies where the active termination match is lost due to
the HF gain roll-off of the LNA. Suggested values are shown in
Table 6; for unterminated applications, reduce the capacitor
value by half.
When a long trace to Pin INH is unavoidable, or if both LNA
outputs drive external circuits, a small ferrite bead (FB) in series
with Pin INH preserves circuit stability with negligible effect on
noise. The bead shown is 75 at 100 MHz (Murata BLM21 or
equivalent). Other values can prove useful.
Figure 70 shows the interconnection details of the LNA output.
Capacitive coupling between the LNA outputs and the VGA
inputs is required because of the differences in their dc levels
and the need to eliminate the offset of the LNA. Capacitor
values of 0.1 F are recommended. There is 0.4 dB loss in gain
between the LNA output and the VGA input due to the 5
output resistance. Additional loading at the LOP and LON
outputs affects LNA gain.
21
22
23
24
28
25
26
27
15
16
20
17
18
19
8
7
6
5
1
4
3
2
14
13
9
12
11
10
VCM2
RCLMP
COMM
VOL2
VOH2
VIP2
GAIN
VIN2
LOP2
COM2
LMD2
LON2
VPS2
INH2
COM1
LOP1
LMD1
LON1
VPS1
INH1
VOH1
ENB
VIP1
VCM1
VIN1
VPSV
VOL1
HILO
0.1 F
C
FB
*
C
LMD
0.1
F
1nF
5V
5V
1n F
R
FB
*
5V
+5V
C
SH
*
*
*
LNA
SOURCE
VGA OUT
VGA OUT
5V
1nF
0.1
F
*
SEE TEXT
LNA OUT
1nF
V
GAIN
FB
1nF
0.1
F
0.1
F
0.1
F
0.1
F
1nF
0.1
F
03199-
C-
06
6
Figure 69. Basic Connections for a Typical Channel (AD8332 Shown)
50
LNA
VIN
VIP
LOP
VCM
100
5
LON
TO EXT
CIRCUIT
TO EXT
CIRCUIT
C
SH
5
50
100
03
199-
C-
067
Figure 70. Interconnections of the LNA and VGA
Both LNA outputs are available for driving external circuits.
Pin LOP should be used in those instances when a single-
ended LNA output is required. The user should be aware of
stray capacitance loading of the LNA outputs, in particular
LON. The LNA can drive 100 in parallel with 10 pF. If an
LNA output is routed to a remote PC board, it tolerates a load
capacitance up to 100 pF with the addition of a 49.9 series
resistor or ferrite 75 /100 MHz bead.
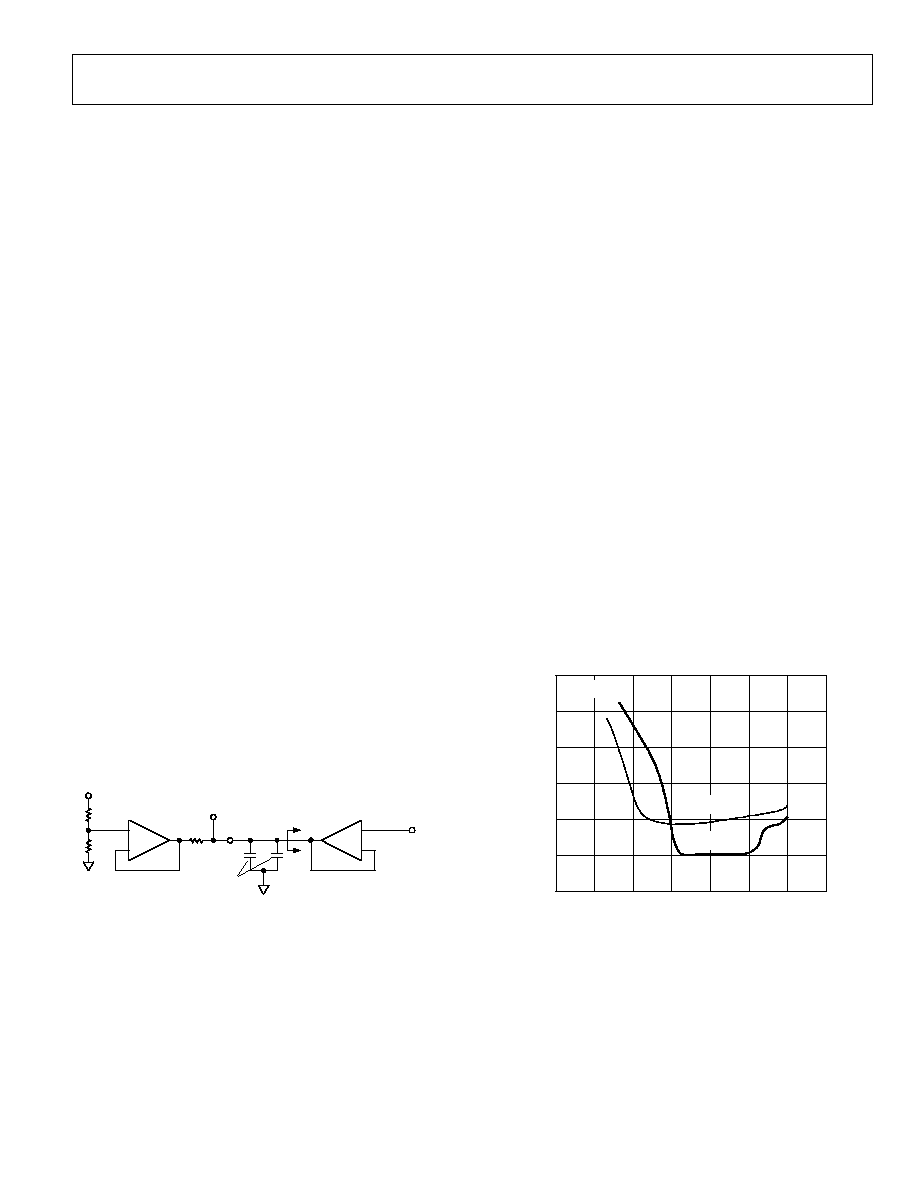
AD8331/AD8332
Rev. D | Page 25 of 36
Gain Input
The GAIN pin is common to both channels of the AD8332. The
input impedance is nominally 10 M and a bypass capacitor
from 100 pF to1 nF is recommended.
Parallel-connected devices can be driven by a common voltage
source or DAC. Decoupling should take into account any
bandwidth considerations of the drive waveform, using the total
distributed capacitance.
If gain control noise in LO gain mode becomes a factor,
maintaining 15 nV/Hz noise at the GAIN pin ensures
satisfactory noise performance. Internal noise prevails below
15 nV/Hz at the GAIN pin. Gain control noise is negligible in
HI gain mode.
VCM Input
The common-mode voltage of Pin VCM, Pin VOL, and
Pin VOH defaults to 2.5 V dc. With output ac-coupled applications,
the VCM pin is unterminated; however, it must still be bypassed
in close proximity for ac grounding of internal circuitry. The
VGA outputs can be dc connected to a differential load, such as
an ADC. Common-mode output voltage levels between 1.5 V
and 3.5 V can be realized at Pin VOH and Pin VOL by applying
the desired voltage at Pin VCM. DC-coupled operation is not
recommended when driving loads on a separate PC board.
The voltage on the VCM pin is sourced by an internal buffer
with an output impedance of 30 and a ±2 mA default output
current (see Figure 71). If the VCM pin is driven from an
external source, its output impedance should be <<30 and its
current drive capability should be >>2 mA. If the VCM pins of
several devices are connected in parallel, the external buffer
should be capable of overcoming their collective output
currents. When a common-mode voltage other than 2.5 V is
used, a voltage-limiting resistor, R
CLMP
, is needed to protect
against overload.
V
CM
NEW V
CM
R
O
<< 30
100pF
2mA MAX
30
0.1
F
INTERNAL
CIRCUITRY
AC GROUNDING FOR
INTERNAL CIRCUITRY
03199-B
-
068
Figure 71. VCM Interface
Logic Inputs--ENB, MODE, and HILO
The input impedance of the enable pins is nominally 25 k and
can be pulled up to 5 V (a pull-up resistor is recommended) or
driven by any 3 V or 5 V logic families. The enable pins perform
a power-down function, when disabled, the VGA outputs are
near ground. Multiple devices can be driven from a common
source. See Table 3, Table 4, and Table 5 for circuit functions
controlled by the enable pins.
Pin HILO is compatible with 3 V or 5 V CMOS logic families. It
is either connected to ground or pulled up to 5 V, depending on
the desired gain range and output noise.
Optional Output Voltage Limiting
The RCLMP pin provides the user with a means to limit the
output voltage swing when used with loads that have no provisions
for prevention of input overdrive. The peak-to-peak limited
voltage is adjusted by a resistor to ground, and Table 7 lists
several voltage levels and the corresponding resistor value.
Unconnected, the default limiting level is 4.5 V p-p.
Note that third harmonic distortion increases as waveform
amplitudes approach clipping. For lowest distortion, the clamp
level should be set higher than the converter input span. A clamp
level of 1.5 V p-p is recommended for a 1 V p-p linear output
range, 2.7 V p-p for a 2 V p-p range, or 1 V p-p for a 0.5 V p-p
operation. The best solution is determined experimentally.
Figure 72 shows third harmonic distortion as a function of the
limiting level for a 2 V p-p output signal. A wider limiting level
is desirable in HI gain mode.
H
D
3
(
d
B
c
)
5.0
≠50
≠40
≠30
≠80
≠70
≠60
2.0
3.5
1.5
3.0
2.5
4.0
4.5
≠20
CLAMP LIMIT LEVEL (V p-p)
V
GAIN
= 0.75V
HILO = HI
HILO = LO
03199-C-069
Figure 72. HD3 vs. Clamping Level for 2 V p-p Differential Input
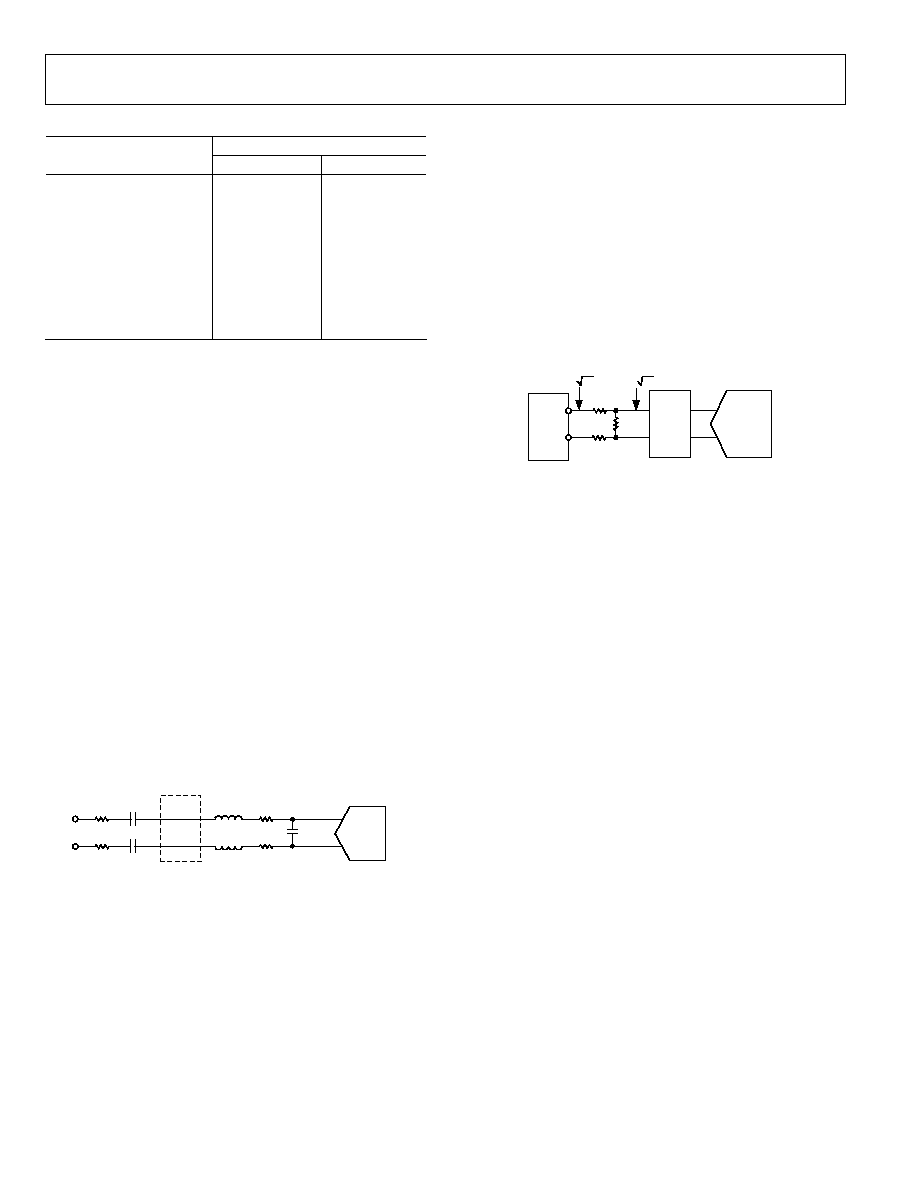
AD8331/AD8332
Rev. D | Page 26 of 36
Table 7. Clamp Resistor Values
Clamp Resistor Value (k)
Clamp Level (V p-p)
HILO = LO
HILO = HI
0.5 1.21
1.0 2.74
2.21
1.5 4.75
4.02
2.0 7.5
6.49
2.5 11
9.53
3.0 16.9
14.7
3.5 26.7
23.2
4.0 49.9
39.2
4.4 100
73.2
Output Filtering and Series Resistor Requirements
To ensure stability at the high end of the gain control range,
series resistors or ferrite beads are recommended for the outputs
when driving large capacitive loads or circuits on other boards.
These components can be part of the external noise filter.
Recommended resistor values are 84.5 for LO gain mode and
100 for HI gain mode (see Figure 69) and are placed near the
VOH and VOL pins. Lower value resistors are permissible for
applications with nearby loads or with gains less than 40 dB.
Lower values are best selected empirically.
An antialiasing noise filter is typically used with an ADC. Filter
requirements are application dependent.
When the ADC resides on a separate board, the majority of
filter components should be placed nearby to suppress noise
picked up between boards and to mitigate charge kickback from
the ADC inputs. Any series resistance beyond that required for
output stability should be placed on the ADC board. Figure 73
shows a second-order, low-pass filter with a bandwidth of
20 MHz. The capacitor is chosen in conjunction with the 10 pF
input capacitance of the ADC.
18pF
OPTIONAL
BACKPLANE
84.5
0.1
F
0.1
F
1.5
H
1.5
H
158
158
84.5
ADC
03199-B
-
070
Figure 73. 20 MHz Second-Order, Low-Pass Filter
DRIVING ADCS
The output drive accommodates a wide range of ADCs. The
noise floor requirements of the VGA depend on a number of
application factors, including bit resolution, sampling rate, full-
scale voltage, and the bandwidth of the noise/antialias filter. The
output noise floor and gain range can be adjusted by selecting
HI or LO gain mode.
The relative noise and distortion performance of the two gain
modes can be compared in Figure 24 and Figure 30 through
Figure 40. The 48 nV/Hz noise floor of the LO gain mode is
suited to converters with higher sampling rates or resolutions
(such as 12 bits). Both gain modes can accommodate ADC full-
scale voltages as high as 4 V p-p. Because distortion performance
remains favorable for output voltages as high as 4 V p-p (see
Figure 35), it is possible to lower the output-referred noise even
further by using a resistive attenuator (or transformer) at the
output. The circuit in Figure 74 has an output full-scale range of
2 V p-p, a gain range of -10.5 dB to +37.5 dB, and an output
noise floor of 24 nV/Hz, making it suitable for some 14-bit
ADC applications.
VOH
VOL
LPF
4V p-p DIFF,
48nV/
187
2V p-p DIFF,
24nV/
2:1
374
Hz
187
ADC
AD6644
Hz
0
3199-
C-
071
Figure 74. Adjusting the Noise Floor for 14-Bit ADCs
OVERLOAD
These devices respond gracefully to large signals that overload
its input stage and to normal signals that overload the VGA
when the gain is set unexpectedly high. Each stage is designed
for clean-limited overload waveforms and fast recovery when
gain setting or input amplitude is reduced.
Signals larger than ±275 mV at the LNA input are clipped to
5 V p-p differential prior to the input of the VGA. Figure 47
shows the response to a 1 V p-p input burst. The symmetric
overload waveform is important for applications, such as CW
Doppler ultrasound, where the spectrum of the LNA outputs
during overload is critical. The input stage is also designed to
accommodate signals as high as ±2.5 V without triggering the
slow-settling ESD input protection diodes.
Both stages of the VGA are susceptible to overload. Postamp
limiting is more common and results in the clean-limited
output characteristics found in Figure 48. Under more extreme
conditions, the X-AMP overloads, causing the minor glitches
evident in Figure 49. Recovery is fast in all cases. Figure 75
summarizes the combinations of input signal and gain that lead
to the different types of overload.
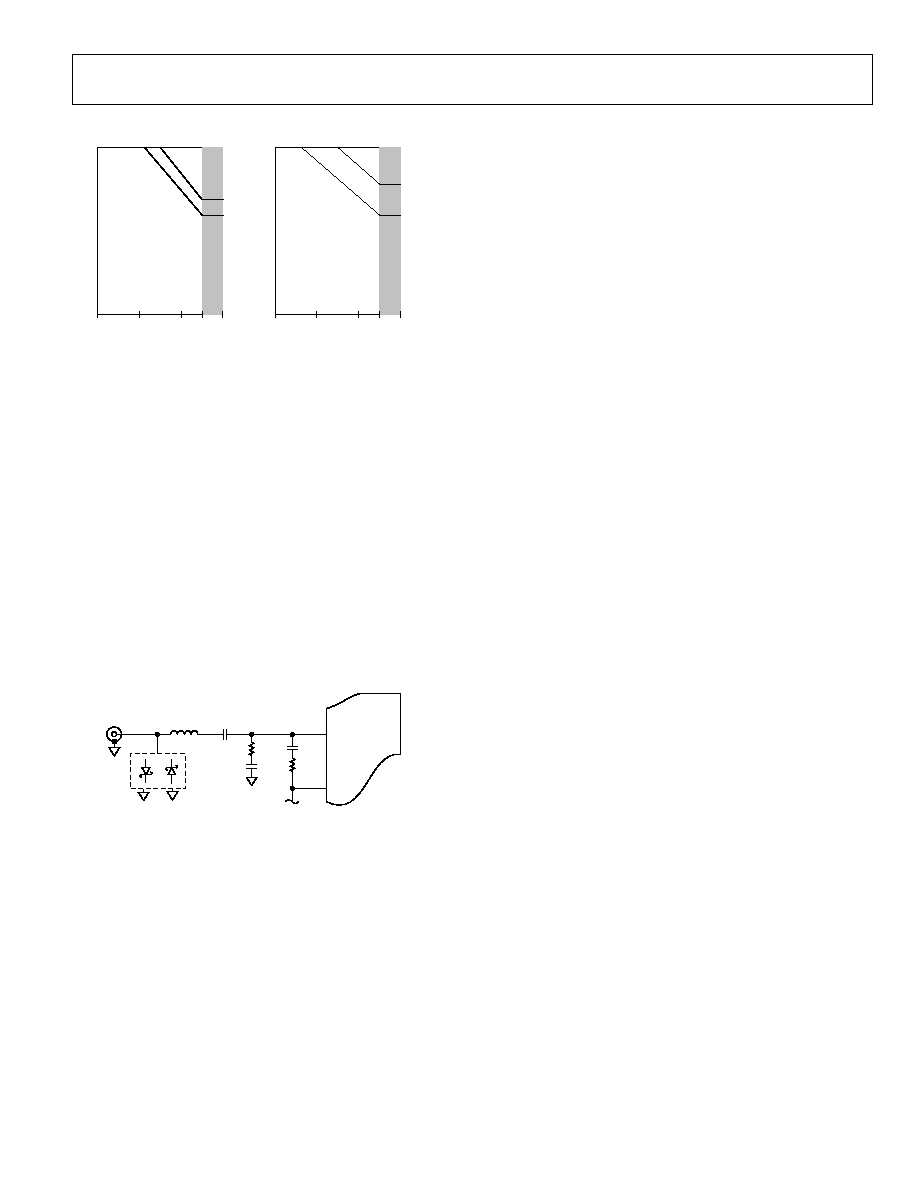
AD8331/AD8332
Rev. D | Page 27 of 36
G
A
IN
(
d
B
)
1m
LO GAIN
MODE
15mV
≠4.5
25mV
L
N
A
O
V
E
R
L
O
A
D
X-AMP
OVERLOAD
POSTAMP
OVERLOAD
X-AMP
OVERLOAD
POSTAMP
OVERLOAD
29dB
43.5
INPUT AMPLITUDE (V)
0.275
0.1
10m
24.5dB
G
A
IN
(
d
B
)
HI GAIN
MODE
4mV
7.5
25mV
L
N
A
O
V
E
R
L
O
A
D
41dB
56.5
INPUT AMPLITUDE (V)
24.5dB
1
1m
0.275
0.1
10m
1
03199-
C
-
072
Figure 75. Overload Gain and Signal Conditions
The previously mentioned clamp interface controls the
maximum output swing of the postamp and its overload
response. When no R
CLMP
resistor is provided, this level defaults
to near 4.5 V p-p differential to protect outputs centered at a
2.5 V common mode. When other common-mode levels are set
through the VCM pin, the value of R
CLMP
should be chosen for
graceful overload. A value of 8.3 k or less is recommended for
1.5 V or 3.5 V common-mode levels (7.2 k for HI gain mode).
This limits the output swing to just above 2 V p-p differential.
OPTIONAL INPUT OVERLOAD PROTECTION
Applications in which high transients are applied to the LNA
input can benefit from the use of clamp diodes. A pair of back-
to-back Schottky diodes can reduce these transients to
manageable levels. Figure 76 illustrates how such a diode-
protection scheme can be connected.
20
19
4
3
2
LON
VPSL
INH
COMM
ENBL
0.1
F
C
SH
FB
C
FB
BAS40-04
R
SH
R
FB
2
3
1
OPTIONAL
SCHOTTKY
OVERLOAD
CLAMP
03199-C-073
Figure 76. Input Overload Clamping
When selecting overload protection, the important parameters
are forward and reverse voltages and t
rr
(or
rr
.). The Infineon
BAS40 series shown in Figure 76 has a
rr
of 100 ps and V
F
of
310 mV at 1 mA. Many variations of these specifications can be
found in vendor catalogs.
LAYOUT, GROUNDING, AND BYPASSING
Due to their excellent high frequency characteristics, these
devices are sensitive to their PCB environment. Realizing
expected performance requires attention to detail critical to
good high speed board design.
A multilayer board with power and ground plane is recommended,
and unused area in the signal layers should be filled with
ground. The multiple power and ground pins provide robust
power distribution to the device and must all be connected. The
power supply pins should each be with multiple values of high
frequency ceramic chip capacitors to maintain low impedance
paths to ground over a wide frequency range. These should
have capacitance values of 0.01 F to 0.1 F in parallel with
100 pF to 1 nF and be placed as close as possible to the pins. The
LNA power pins should be decoupled from the VGA using ferrite
beads. Together with the decoupling capacitors, ferrite beads
help eliminate undesired high frequencies without reducing the
headroom, as do small value resistors.
Several critical LNA areas require special care. The LON and
LOP output traces must be as short as possible before connecting to
the coupling capacitors connected to the VIN and VIP pins. R
FB
must be placed nearby the LON pin as well. Resistors must be
placed as close as possible to the VGA output pins, VOL and
VOH, to mitigate loading effects of connecting traces. Values
are discussed in the Output Filtering and Series Resistor
Requirements section.
Signal traces must be short and direct to avoid parasitic effects.
Wherever there are complementary signals, symmetrical layout
should be employed to maintain waveform balance. PCB traces
should be kept adjacent when running differential signals over a
long distance.
MULTIPLE INPUT MATCHING
Matching of multiple sources with dissimilar impedances can be
accomplished as shown in Figure 78. A relay and low supply
voltage analog switch can be used to select between multiple
sources and their associated feedback resistors. An
ADG736
dual SPDT switch is shown in this example; however, multiple
switches are also available and users are referred to the Analog
Devices, Inc. Selection Guide for switches and multiplexers.
DISABLING THE LNA
Where accessible, connection of the LNA enable pin to ground
powers down the LNA, resulting in a current reduction of about
half. In this mode, the LNA input and output pins can be left
unconnected; however, the power must be connected to the
supply pins for the disabling circuit to function. Figure 77
illustrates the connections using an AD8331 as an example.
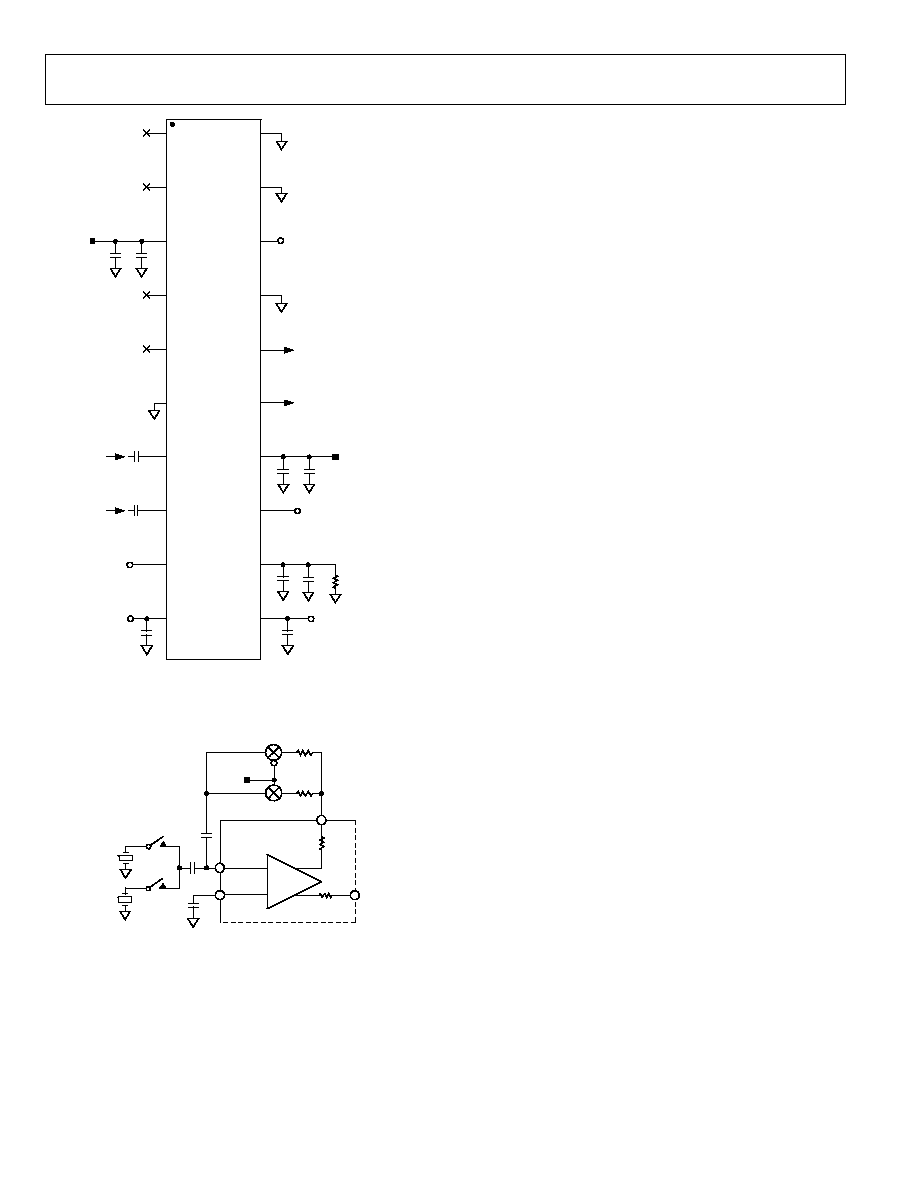
AD8331/AD8332
Rev. D | Page 28 of 36
15
16
20
17
18
19
8
7
6
5
1
4
3
2
9
13
10
COMM
VIP
LOP
COML
LMD
LON
VPSL
INH
COMM
ENBV
ENBL
GAIN
0.1
F
HILO
+5V
+5V
C
FB
0.018
F
NC
VOH
VOL
VOUT
VPOS
+5V
14
11
12
VCM
R
CLMP
NC
NC
NC
VIN
0.1
F
AD8331
MODE
031
99-C-
0
7
4
GAIN
MODE
VCM
HILO
VIN
RCLMP
MEASUREMENT CONSIDERATIONS
Figure 54 through Figure 58 show typical measurement
configurations and proper interface values for measurements
with 50 conditions.
Short-circuit input noise measurements are made using Figure 56.
The input-referred noise level is determined by dividing the
output noise by the numerical gain between Point A and Point B
and accounting for the noise floor of the spectrum analyzer.
The gain should be measured at each frequency of interest and
with low signal levels because a 50 load is driven directly. The
generator is removed when noise measurements are made.
ULTRASOUND TGC APPLICATION
The AD8332 ideally meets the requirements of medical and
industrial ultrasound applications. The TGC amplifier is a key
subsystem in such applications, because it provides the means
for echolocation of reflected ultrasound energy.
Figure 79 through Figure 81 are schematics of a dual, fully
differential system using the AD8332 and
AD9238
, 12-bit high
speed ADC, with conversion speeds as high as 65 MSPS. In this
example, the VGA outputs are dc-coupled, using the reference
output of the ADC and a level shifter to center the common-
mode output voltage to match that of the converter. Consult the
data sheet of the converter to determine whether external CMV
biasing is required. AC coupling is recommended if the CMV of
the VGA and ADC are widely disparate.
Using the EVAL-AD8332/AD9238 evaluation board and a high
speed ADC FIFO evaluation kit connected to a laptop, an FFT
can be performed on the AD8332. With the on-board clock of
20 MHz, minimal low-pass filtering, and both channels driven
with a 1 MHz filtered sine wave, THD is -75 dB, noise floor is
-93 dB, and HD2 is -83 dB.
Figure 77. Disabling the LNA
INH
LNA
5
LMD
LOP
ADG736
LON
200
50
0.1
F
18nF
SELECTR
FB
280
1.13k
AD8332
03199-C-075
5
Figure 78. Accommodating Multiple Sources
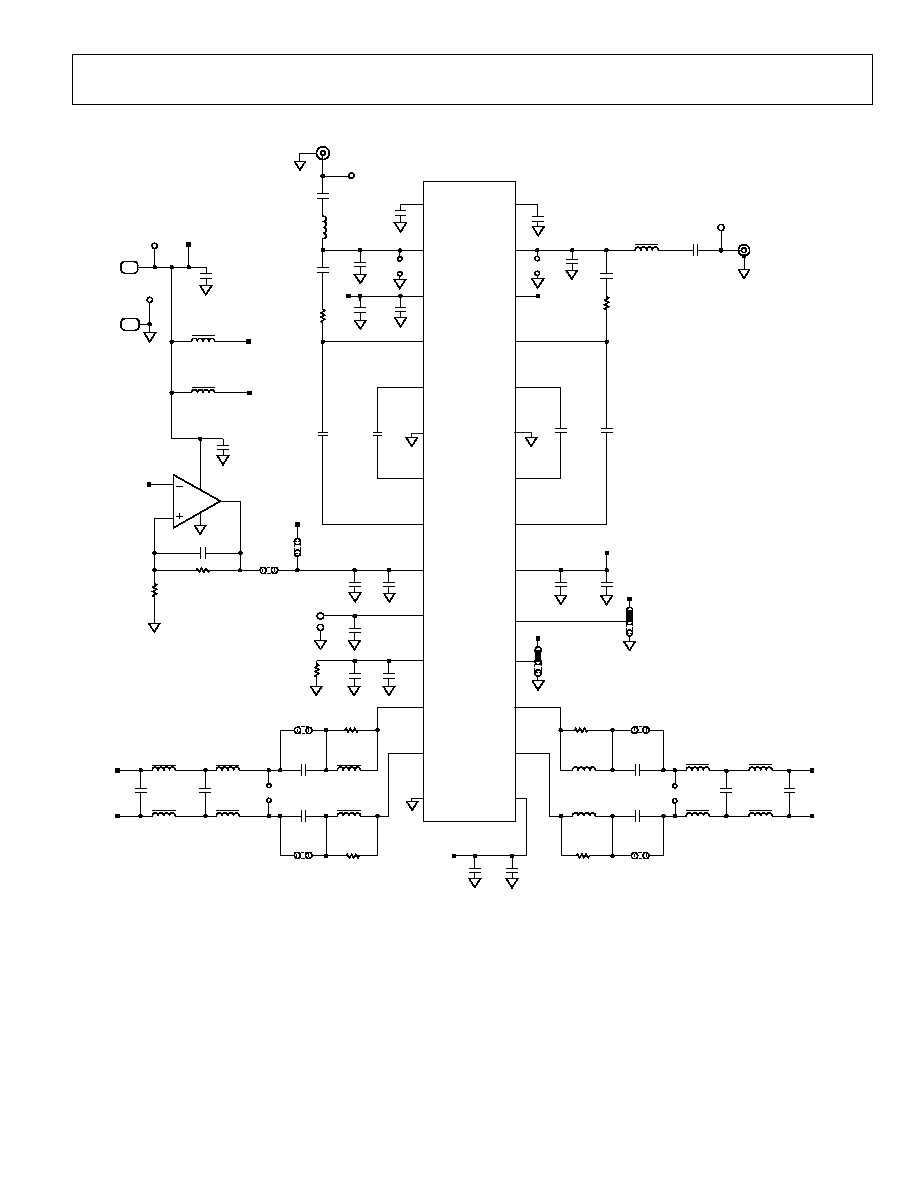
AD8331/AD8332
Rev. D | Page 29 of 36
TB1
+5V
TB2
GND
C46
1
F
+5VLNA
+5VGA
L7
120nH FB
L6
120nH FB
TP4
(BLACK)
TP3
(RED)
VOH1
21
25
VIN1
LON1
C78
1nF
C58
0.1
F
17
AD8332ARU
V
IN
+A
1
LMD2
C49
0.1
F
2 INH2
C80
22pF
3
VPS2
CFB1
18nF
C59
0.1
F
C41
0.1
F
C74
1nF
4
LON2
7
5
VIP2
LOP2
C53
0.1
F
VPS1 26
COM2
6
COM1
23
8
VIN2
C51
0.1
F
27
INH1
S1
E
IN1
C60
0.1
F
C79
22pF
L13
120nH FB
TP6
28
LMD1
C70
0.1
F
COM
14
9
VCM2
C48
0.1
F
10
GAIN
C83
1nF
11
RCLMP
R3
(R
CLMP
)
C54
0.1
F
VOH2
12
V
IN
+B
C55
0.1
F
VOL2
13
JP12
VPSV
15
C45
0.1
F
C85
1nF
VOL1
C56
0.1
F
16
L8
120nF FB
18
ENB
+5VGA
19
HILO
20
VCM1
C43
0.1
F
C77
1nF
22
24
VIP1
LOP1
+5VLNA
VCM1
0.1
F
AD8541
VCM
R22
1k
R23
2k
7
6
3
2
100
RFB1
274
RFB2
274
VREF
C50
0.1
F
S3
E
IN2
L12
120nH FB
TP5
CFB2
18nF
C71 1nF
C68
1nF
C69
0.1
F
R27
100
L11
120nH FB
JP8
DC2H
L10
120nH FB
JP7
DC2L
R26
+5VGA
ENABLE
HI GAIN
DISABLE
LO GAIN
L9
120nH FB
R24
100
JP9
JP10
JP17
TP2 GAIN
JP5
IN2
JP6
IN1
TP7 GND
L17
SAT
L18
SAT
L19
SAT
L20
SAT
C67
SAT
C66
SAT
L1
SAT
L14
SAT
L15
SAT
L16
SAT
C64
SAT
C65
SAT
OPTIONAL 4-POLE LOW-PASS
FILTER
OPTIONAL 4-POLE LOW-PASS
FILTER
JP14
JP13
VCM1
4
+5VGA
JP10
JP16
R25
100
+
+5VLNA
+5V
V
IN
≠B
C42
0.1
F
V
IN
≠A
03199-C-076
Figure 79. Schematic, TGC, VGA Section
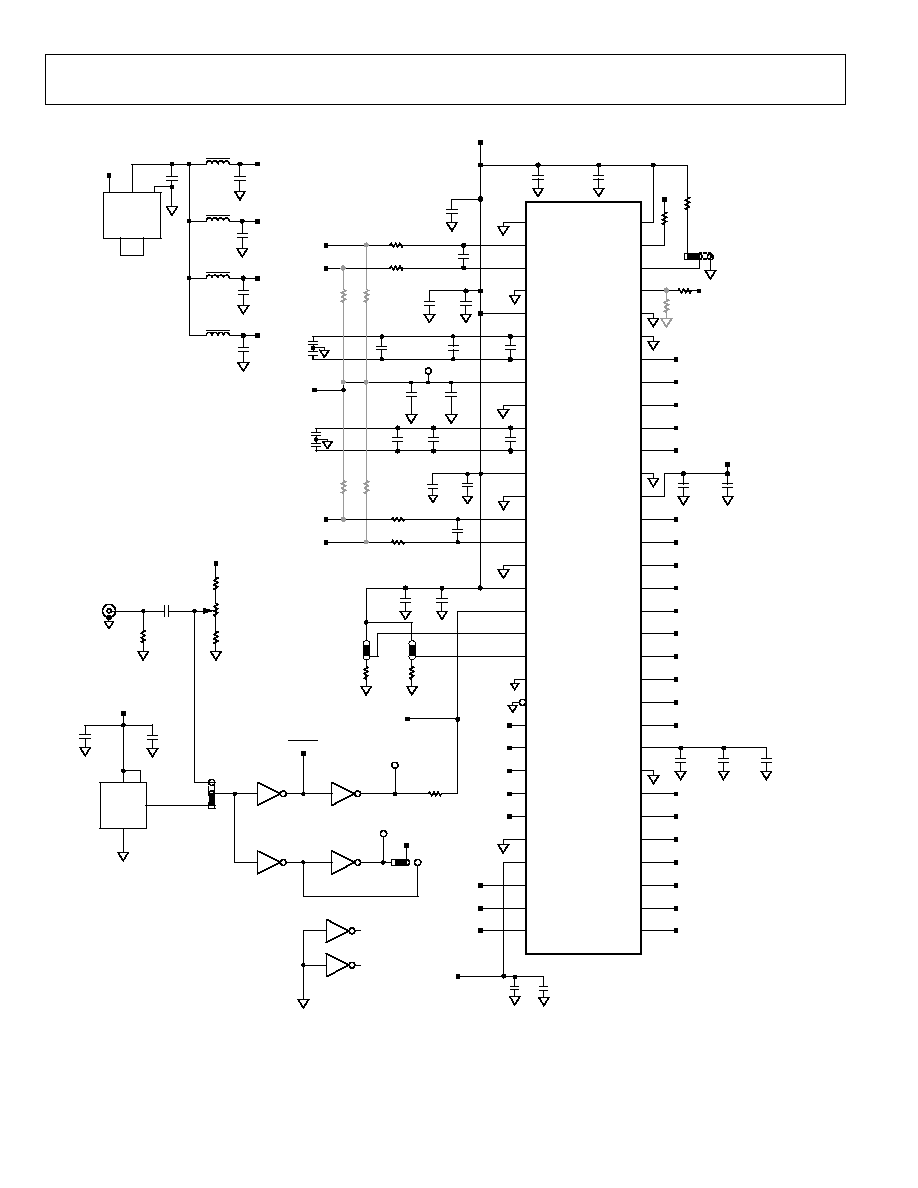
AD8331/AD8332
Rev. D | Page 30 of 36
VREF
VIN+_A
VIN ≠_A
VIN ≠_B
VIN+_B
MUX_SELECT
1
2
3
17
AVDD
62
SHARED_REF
6
7
REFT_A
REFB_A
SENSE
11
10
REFT_B
REFB_B
14
15
CLK_A
18
CLK_B
63
DCS
19
DFS
20
PDWN_B
PDWN_A
60
21
OEB_B
22
16
4
13
AGND
AGND
64
12
5
AVDD
AVDD
AVDD
8
9
AGND
AGND
D5_B
D4_B
D3_B
DRGND
D2_B
D1_B
D0_B
DNC
DNC
52
51
50
49
48
47
46
45
44
43
42
41
40
39
38
37
36
35
34
33
32
31
30
29
28
27
26
25
24
23
DRVDD
D10_A
D11_A
OTR_A
D11_A
DRGND
D8_A
DRVDD
D7_A
D6_A
D5_A
D4_A
D3_A
D2_A
D1_A
D0_A
DRVDD
D10_A
DRGND
OTR_B
61
D9_A
59
58
57
56
55
54
53
OTR_A
U1 A/D CONVERTER AD9238
D9_A
D8_A
D6_A
D7_A
D5_A
D4_A
D3_A
D2_A
D1_A
D0_A
DNC
DNC
D4_B
D3_B
D2_B
D1_B
D0_B
DNC
DNC
OTR_B
D11_B
D10_B
D9_B
D8_B
D7_B
D6_B
D5_B
20MHz
ADCLK
+3.3VCLK
ADCLK
+3.3VAVDD
V
IN
≠B
V
IN
+B
+
+3.3VADDIG
SG-636PCE
1
4
3
2
U5
74VHC04
+
+
TP 9
TP 12
4
3
1
2
12
13
10
11
U5
74VHC04
U5
74VHC04
U5
74VHC04
U5
74VHC04
U5
74VHC04
SPARES
8
9
6
5
TP 13
JP 1
3
2
1
V
DD
OUT
GND
OE
JP 4
S2
EXT CLOCK
+
JP 11
JP 3
JP 2
SHARED
REF
+3.3VADDIG
Y
D10_B
D9_B
D8_B
D7_B
D6_B
D11_B
DNC
DNC
OEB_A
EXT
INT
V
IN
+_A
V
IN
≠_A
N
DATA
CLK
VREF
C11
10
F
6.3V
C14
0.1
F
C23
0.1
F
C25
1nF
R14
4.7k
R11
100
R10
0
R15
0
C22
0.1
F
C21
1nF
C86
0.1
F
C47
10
F
6.3V
ADCLK
C2
10
F
6.3V
C18
1nF
C17
0.1
F
C52
10nF
C57
10nF
C61
18pF
C40
0.1
F
R5
33
R6
33
R4
1.5k
R12
1.5k
1.5k
1.5k
C12
10
F
6.3V
R9
0
R8
33
R7
33
C19
1nF
C20
0.1
F
C63
0.1
F
C26
0.1
F
C24
1nF
C33
10
F
6.3V
C38
0.1
F
C16
0.1
F
C62
18pF
C15
1nF
C35
0.1
F
C36
0.1
F
C37
0.1
F
R20
4.7k
R17
49.9
R41
4.7k
+3.3VCLK
R19
499
R16
5k
R18
499
+
+3.3VADDIG
3
2
1
C32
0.1
F
C39
10
F
C34
10
F
6.3V
C44
1
F
C31
0.1
F
C30
0.1
F
C29
0.1
F
C1
0.1
F
OUT
VR1
ADP3339AKC-3.3
L2
120nH FB
L3
120nH FB
L4
120nH FB
L5
120nH FB
IN
OUT
GND
3
1
2
TAB
+
+5V
03199-C-077
C13
1nF
+3.3VCLK
+3.3VADDIG
+3.3VAVDD
+3.3VDVDD
U6
Figure 80. Converter Schematic
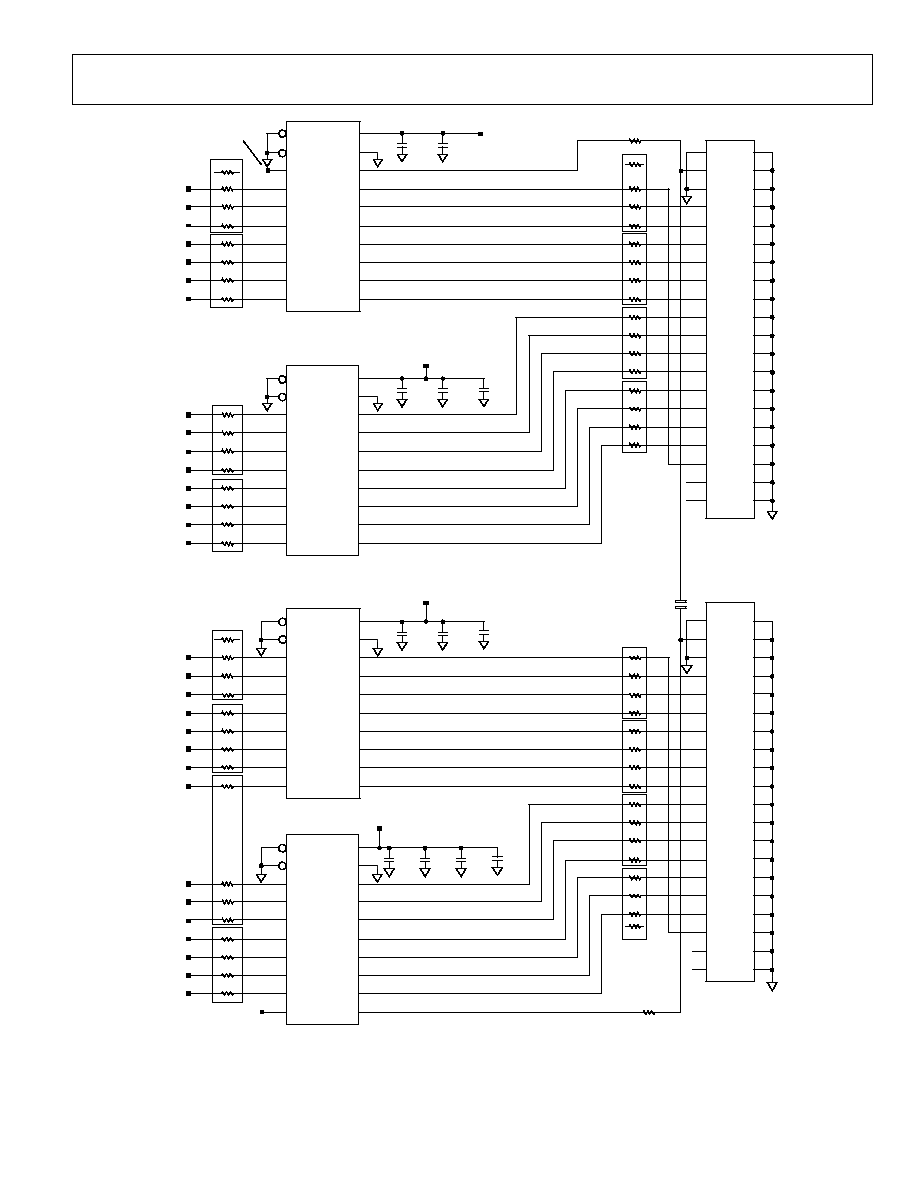
AD8331/AD8332
Rev. D | Page 31 of 36
19
1
D10_A
D11_A
24
39
VCC
GND
Y1
A1
G1
1
2
3
6
7
10
4
5
8
9
17
11
14
15
18
19
20
+
16
13
12
G2
A8
A7
A6
A5
A4
A3
A2
Y8
Y7
Y6
Y5
Y4
Y3
Y2
VCC
GND
Y1
A1
G1
1
2
3
6
7
10
4
5
8
9
17
11
14
15
18
19
20
+
16
13
12
G2
A8
A7
A6
A5
A4
A3
A2
Y8
Y7
Y6
Y5
Y4
Y3
Y2
VCC
GND
Y1
A1
G1
1
2
3
6
7
10
4
5
8
9
17
11
14
15
18
19
20
+
+
16
13
12
G2
A8
A7
A6
A5
A4
A3
A2
Y8
Y7
Y6
Y5
Y4
Y3
Y2
VCC
GND
Y1
A1
G1
1
2
3
6
7
10
4
5
8
9
17
11
14
15
18
19
20
+
16
13
12
G2
A8
A7
A6
A5
A4
A3
A2
Y8
Y7
Y6
Y5
Y4
Y3
Y2
2
3
6
7
10
4
5
8
9
17
11
14
15
18
20
16
13
12
37
21
26
25
30
22
23
28
27
35
29
34
33
38
40
36
31
32
R39
22
DATACLKA
OTR_A
D9_A
D8_A
D6_A
D7_A
D5_A
D4_A
D3_A
D2_A
D1_A
D0_A
DNC
DNC
OTR_B
D11_B
D10_B
D9_B
D8_B
D7_B
D6_B
D5_B
D4_B
D3_B
D2_B
D1_B
D0_B
DNC
DNC
+3.3VDVDD
+3.3VDVDD
+3.3VDVDD
DATACLK
U3
74VHC541
U10
74VHC541
U7
74VHC541
U2
74VHC541
SAM080UPM
76
61
79
58
41
80
77
73
72
78
75
74
71
63
69
68
65
64
62
66
67
70
43
59
56
55
52
60
57
54
53
45
51
48
47
44
42
46
49
50
SAM080UPM
RP 9
1
8
7
6
5
4
3
2
1
8
7
6
5
4
3
2
1
8
7
6
5
4
3
2
1
8
7
6
5
4
3
2
1
8
7
6
5
4
3
2
1
8
7
6
5
4
3
2
7
6
5
4
3
2
1
8
7
6
5
4
3
2
RP 11
RP 12
RP 13
RP 14
1
8
RP 15
RP 16
R40
22
1
8
7
6
5
4
3
2
RP 1
1
8
7
6
5
4
3
2
RP2
1
8
7
6
5
4
3
2
RP 3
1
8
7
6
5
4
3
2
RP 4
1
8
7
6
5
4
3
2
RP 5
1
8
7
6
5
4
3
2
RP 6
1
8
7
6
5
4
3
2
RP 7
1
8
7
6
5
4
3
2
RP 8
22
◊
4
22
◊
4
RP 10
22
◊
4
22
◊
4
22
◊
4
22
◊
4
22
◊
4
22
◊
4
H
EADER
UP
MALE
NO
SHRO
UD
HEADER
UP
MA
L
E
NO
SHR
OUD
C3
0.1
F
C28
10
F
6.3V
C8
0.1
F
C10
0.1
F
C76
10
F
6.3V
C7
0.1
F
C9
0.1
F
C27
10
F
6.3V
C4
0.1
F
C5
0.1
F
C6
0.1
F
C75
10
F
6.3V
+3.3VDVDD
22
◊
4
22
◊
4
22
◊
4
22
◊
4
22
◊
4
22
◊
4
22
◊
4
22
◊
4
03199-
B
-
078
Figure 81. Interface Schematic
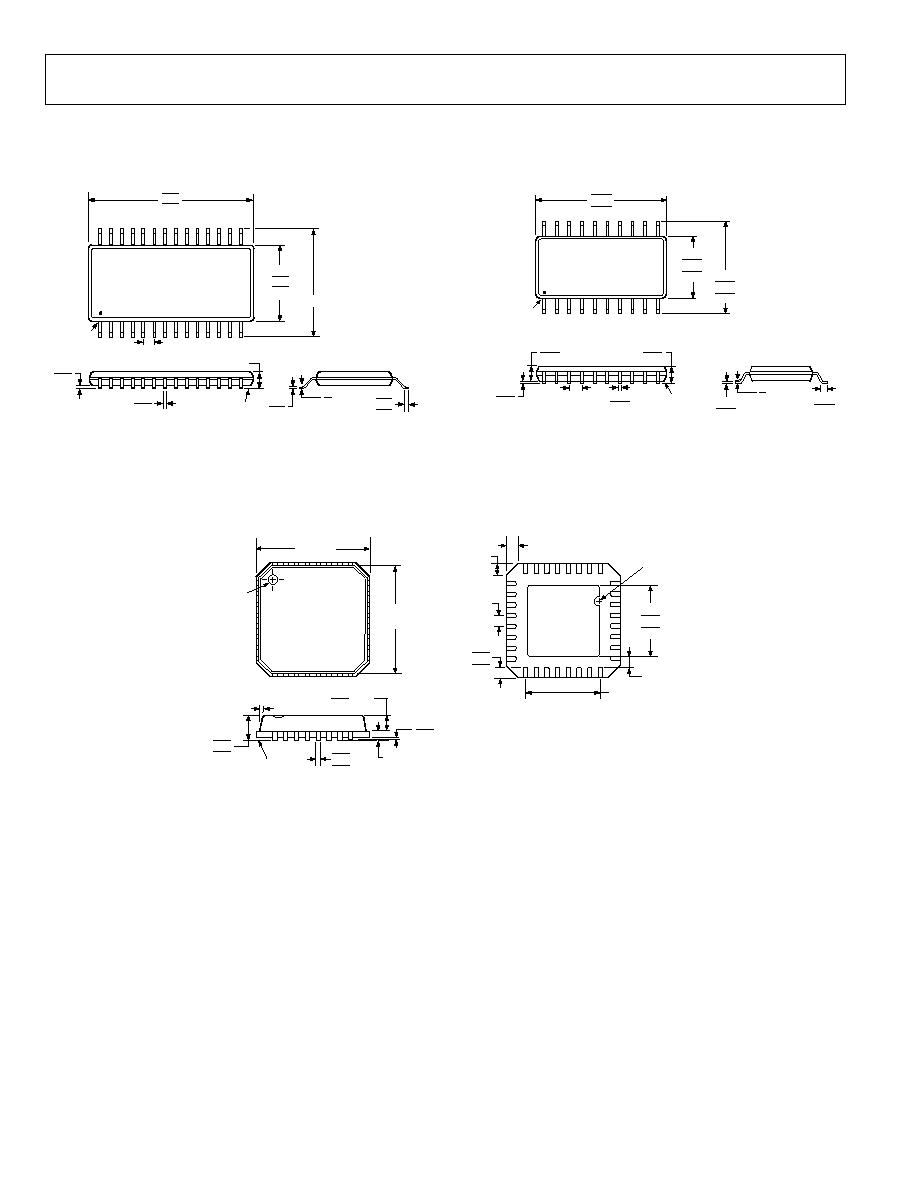
AD8331/AD8332
Rev. D | Page 32 of 36
OUTLINE DIMENSIONS
COMPLIANT TO JEDEC STANDARDS MO-153-AE
2 8
1 5
1 4
1
8 ∞
0 ∞
SEATING
PLANE
COPLANARITY
0.10
1.20 MAX
6.40 BSC
0.65
BSC
PIN 1
0.30
0.19
0.20
0.09
4.50
4.40
4.30
0.75
0.60
0.45
9.80
9.70
9.60
0.15
0.05
Figure 82. 28-Lead Thin Shrink Small Outline Package [TSSOP]
(RU-28)
Dimensions shown in millimeters
COMPLIANT TO JEDEC STANDARDS MO-137-AD
20
11
10
1
PIN 1
8∞
0∞
0.010
0.004
0.012
0.008
0.025
BSC
COPLANARITY
0.004
0.065
0.049
0.069
0.053
SEATING
PLANE
0.010
0.006
0.050
0.016
0.345
0.341
0.337
0.158
0.154
0.150
0.244
0.236
0.228
Figure 83. 20-Lead Shrink Small Outline Package [QSOP]
(RQ-20)
Dimensions shown in inches
COMPLIANT TO JEDEC STANDARDS MO-220-VHHD-2
0.30
0.23
0.18
0.20 REF
0.80 MAX
0.65 TYP
0.05 MAX
0.02 NOM
12∞ MAX
1.00
0.85
0.80
SEATING
PLANE
COPLANARITY
0.08
1
32
8
9
25
24
16
17
0.50
0.40
0.30
3.50 REF
0.50
BSC
PIN 1
INDICATOR
TOP
VIEW
5.00
BSC SQ
4.75
BSC SQ
3.25
3.10 SQ
2.95
PIN 1
INDICATOR
0.60 MAX
0.60 MAX
0.25 MIN
EXPOSED
PAD
(BOTTOM VIEW)
Figure 84. 32-Lead Lead Frame Chip Scale Package [LFCSP_VQ]
5 mm ◊ 5 mm Body, Very Thin Quad
(CP-32-2)
Dimensions shown in millimeters
AD8331/AD8332
Rev. D | Page 33 of 36
ORDERING GUIDE
Model
Temperature Range
Package Description
Package Outline
AD8331ARQ
≠40∞C to +85∞C
20-Lead Shrink Small Outline Package (QSOP)
RQ-20
AD8331ARQ-REEL
≠40∞C to +85∞C
20-Lead Shrink Small Outline Package (QSOP)
RQ-20
AD8331ARQ-REEL7
≠40∞C to +85∞C
20-Lead Shrink Small Outline Package (QSOP)
RQ-20
AD8331ARQZ
1
≠40∞C to +85∞C
20-Lead Shrink Small Outline Package (QSOP)
RQ-20
AD8331ARQZ-RL
1
≠40∞C to +85∞C
20-Lead Shrink Small Outline Package (QSOP)
RQ-20
AD8331ARQZ-R7
1
≠40∞C to +85∞C
20-Lead Shrink Small Outline Package (QSOP)
RQ-20
AD8331-EVAL
Evaluation Board with AD8331ARQ
AD8332ACP-R2
≠40∞C to +85∞C
32-Lead Lead Frame Chip Scale Package (LFCSP_VQ)
CP-32-2
AD8332ACP-REEL
≠40∞C to +85∞C
32-Lead Lead Frame Chip Scale Package (LFCSP_VQ)
CP-32-2
AD8332ACP-REEL7
≠40∞C to +85∞C
32-Lead Lead Frame Chip Scale Package (LFCSP_VQ)
CP-32-2
AD8332ACPZ-R7
1
≠40∞C to +85∞C
32-Lead Lead Frame Chip Scale Package (LFCSP_VQ)
CP-32-2
AD8332ACPZ-RL
1
≠40∞C to +85∞C
32-Lead Lead Frame Chip Scale Package (LFCSP_VQ)
CP-32-2
AD8332ARU
≠40∞C to +85∞C
28-Lead Thin Shrink Small Outline Package (TSSOP)
RU-28
AD8332ARU-REEL
≠40∞C to +85∞C
28-Lead Thin Shrink Small Outline Package (TSSOP)
RU-28
AD8332ARU-REEL7
≠40∞C to +85∞C
28-Lead Thin Shrink Small Outline Package (TSSOP)
RU-28
AD8332ARUZ
1
≠40∞C to +85∞C
28-Lead Thin Shrink Small Outline Package (TSSOP)
RU-28
AD8332ARUZ-R7
1
≠40∞C to +85∞C
28-Lead Thin Shrink Small Outline Package (TSSOP)
RU-28
AD8332ARUZ-RL
1
≠40∞C to +85∞C
28-Lead Thin Shrink Small Outline Package (TSSOP)
RU-28
AD8332-EVAL
Evaluation Board with AD8332ARU
EVAL-AD8332/AD9238
Evaluation
Board with AD8332ARU and AD9238
1
Z = Pb-free part.

AD8331/AD8332
Rev. D | Page 34 of 36
NOTES

AD8331/AD8332
Rev. D | Page 35 of 36
NOTES

AD8331/AD8332
Rev. D | Page 36 of 36
NOTES
©2006 Analog Devices, Inc. All rights reserved. Trademarks and
registered trademarks are the property of their respective owners.
C03199-0-3/06(D)