
©
Semiconductor Components Industries, LLC, 2006
July, 2006 - Rev. 0
1
Publication Order Number:
NTMFS4834N/D
NTMFS4834N
Power MOSFET
30 V, 130 A, Single N-Channel, SO-8 FL
Features
∑
Low R
DS(on)
to Minimize Conduction Losses
∑
Low Capacitance to Minimize Driver Losses
∑
Optimized Gate Charge to Minimize Switching Losses
∑
These are Pb-Free Devices*
Applications
∑
CPU Power Delivery
∑
DC-DC Converters
∑
Low Side Switching
MAXIMUM RATINGS
(T
J
= 25
∞
C unless otherwise stated)
Parameter
Symbol
Value
Unit
Drain-to-Source Voltage
V
DSS
30
V
Gate-to-Source Voltage
V
GS
20
V
Continuous Drain
Current R
q
JA
(Note 1)
Steady
State
T
A
= 25
∞
C
I
D
21
A
T
A
= 85
∞
C
15
Power Dissipation
R
q
JA
(Note 1)
T
A
= 25
∞
C
P
D
2.31
W
Continuous Drain
Current R
q
JA
(Note 2)
T
A
= 25
∞
C
ID
13
A
T
A
= 85
∞
C
9.5
Power Dissipation
R
q
JA
(Note 2)
T
A
= 25
∞
C
P
D
0.9
W
Continuous Drain
Current R
q
JC
(Note 1)
T
C
= 25
∞
C
I
D
130
A
T
C
= 85
∞
C
93
Power Dissipation
R
q
JC
(Note 1)
T
C
= 25
∞
C
P
D
86.2
W
Pulsed Drain
Current
T
A
= 25
∞
C,
t
p
= 10
m
s
I
DM
260
A
Operating Junction and Storage
Temperature
T
J
, T
STG
-55 to
+150
∞
C
Source Current (Body Diode)
I
S
71
A
Drain to Source DV/DT
dV/dt
6
V/ns
Single Pulse Drain-to-Source Avalanche
Energy (T
J
= 25
∞
C, V
DD
= 30 V, V
GS
= 10 V,
I
L
= 32 A
pk
, L = 1.0 mH, R
G
= 25
W)
EAS
512
mJ
Lead Temperature for Soldering Purposes
(1/8" from case for 10 s)
T
L
260
∞
C
Stresses exceeding Maximum Ratings may damage the device. Maximum
Ratings are stress ratings only. Functional operation above the Recommended
Operating Conditions is not implied. Extended exposure to stresses above the
Recommended Operating Conditions may affect device reliability.
1. Surface-mounted on FR4 board using 1 sq-in pad, 1 oz Cu.
2. Surface-mounted on FR4 board using the minimum recommended pad size.
*For additional information on our Pb-Free strategy and soldering details, please
download the ON Semiconductor Soldering and Mounting Techniques
Reference Manual, SOLDERRM/D.
MARKING
DIAGRAM
http://onsemi.com
A
= Assembly Location
Y
= Year
WW
= Work Week
G
= Pb-Free Package
(Note: Microdot may be in either location)
V
(BR)DSS
R
DS(ON)
MAX
I
D
MAX
30 V
3.0 m
W
@ 10 V
130 A
4.0 m
W
@ 4.5 V
G (4)
S (1,2,3)
N-CHANNEL MOSFET
D (5,6)
Device
Package
Shipping
ORDERING INFORMATION
NTMFS4834NT1G
SO-8 FL
(Pb-Free)
1500 Tape / Reel
For information on tape and reel specifications,
including part orientation and tape sizes, please
refer to our Tape and Reel Packaging Specification
Brochure, BRD8011/D.
NTMFS4834NT3G
SO-8 FL
(Pb-Free)
5000 Tape / Reel
SO-8 FLAT LEAD
CASE 488AA
STYLE 1
1
4834N
AYWW
G
G
S
S
S
G
D
D
D
D
NTMFS4834N
http://onsemi.com
2
THERMAL RESISTANCE MAXIMUM RATINGS
Parameter
Symbol
Value
Unit
Junction-to-Case (Drain)
R
q
JC
1.45
∞
C/W
Junction-to-Ambient ≠ Steady State (Note 3)
R
q
JA
54
Junction-to-Ambient ≠ Steady State (Note )
R
q
JA
138.7
3. Surface-mounted on FR4 board using 1 sq-in pad, 1 oz Cu.
4. Surface-mounted on FR4 board using the minimum recommended pad size.
ELECTRICAL CHARACTERISTICS
(T
J
= 25
∞
C unless otherwise specified)
Parameter
Symbol
Test Condition
Min
Typ
Max
Unit
OFF CHARACTERISTICS
Drain-to-Source Breakdown Voltage
V
(BR)DSS
V
GS
= 0 V, I
D
= 250
m
A
30
V
Drain-to-Source Breakdown Voltage
Temperature Coefficient
V
(BR)DSS
/
T
J
21
mV/
∞
C
Zero Gate Voltage Drain Current
I
DSS
V
GS
= 0 V,
V
DS
= 24 V
T
J
= 25
∞
C
1
m
A
T
J
= 125
∞
C
10
Gate-to-Source Leakage Current
I
GSS
V
DS
= 0 V, V
GS
=
±
20 V
±
100
nA
ON CHARACTERISTICS (Note 5)
Gate Threshold Voltage
V
GS(TH)
V
GS
= V
DS
, I
D
= 250
m
A
1.5
2.5
V
Negative Threshold Temperature Coefficient
V
GS(TH)
/T
J
6.1
mV/
∞
C
Drain-to-Source On Resistance
R
DS(on)
V
GS
= 10 V to
11.5 V
I
D
= 30 A
2.6
3.0
m
W
I
D
= 15 A
2.5
V
GS
= 4.5 V
I
D
= 30 A
3.5
4.0
I
D
= 15 A
3.4
Forward Transconductance
g
FS
V
DS
= 15 V, I
D
= 15 A
35.2
S
CHARGES, CAPACITANCES & GATE RESISTANCE
Input Capacitance
C
ISS
V
GS
= 0 V, f = 1 MHz, V
DS
= 12 V
4500
pF
Output Capacitance
C
OSS
960
Reverse Transfer Capacitance
C
RSS
500
Total Gate Charge
Q
G(TOT)
V
GS
= 4.5 V, V
DS
= 15 V; I
D
= 30 A
32
48
nC
Threshold Gate Charge
Q
G(TH)
5.4
Gate-to-Source Charge
Q
GS
12
Gate-to-Drain Charge
Q
GD
11
Total Gate Charge
Q
G(TOT)
V
GS
= 11.5 V, V
DS
= 15 V;
I
D
= 30 A
74
nC
SWITCHING CHARACTERISTICS (Note 6)
Turn-On Delay Time
t
d(ON)
V
GS
= 4.5 V, V
DS
= 15 V, I
D
= 15 A,
R
G
= 3.0
W
20
ns
Rise Time
t
r
34
Turn-Off Delay Time
t
d(OFF)
22
Fall Time
t
f
23
Turn-On Delay Time
t
d(ON)
V
GS
= 11.5 V, V
DS
= 15 V,
I
D
= 15 A, R
G
= 3.0
W
11
ns
Rise Time
t
r
23
Turn-Off Delay Time
t
d(OFF)
37
Fall Time
t
f
15
5. Pulse Test: pulse width
v
300
m
s, duty cycle
v
2%.
6. Switching characteristics are independent of operating junction temperatures.
NTMFS4834N
http://onsemi.com
3
ELECTRICAL CHARACTERISTICS
(T
J
= 25
∞
C unless otherwise specified)
Parameter
Unit
Max
Typ
Min
Test Condition
Symbol
DRAIN-SOURCE DIODE CHARACTERISTICS
Forward Diode Voltage
V
SD
V
GS
= 0 V,
I
S
= 30 A
T
J
= 25
∞
C
0.77
1.2
V
T
J
= 125
∞
C
0.70
Reverse Recovery Time
t
RR
V
GS
= 0 V, dIS/dt = 100 A/
m
s,
I
S
= 30 A
34
ns
Charge Time
t
a
18
Discharge Time
t
b
16
Reverse Recovery Charge
Q
RR
25.9
nC
PACKAGE PARASITIC VALUES
Source Inductance
L
S
T
A
= 25
∞
C
0.65
nH
Drain Inductance
L
D
0.005
nH
Gate Inductance
L
G
1.84
nH
Gate Resistance
R
G
1.4
W
5. Pulse Test: pulse width
v
300
m
s, duty cycle
v
2%.
6. Switching characteristics are independent of operating junction temperatures.

NTMFS4834N
http://onsemi.com
4
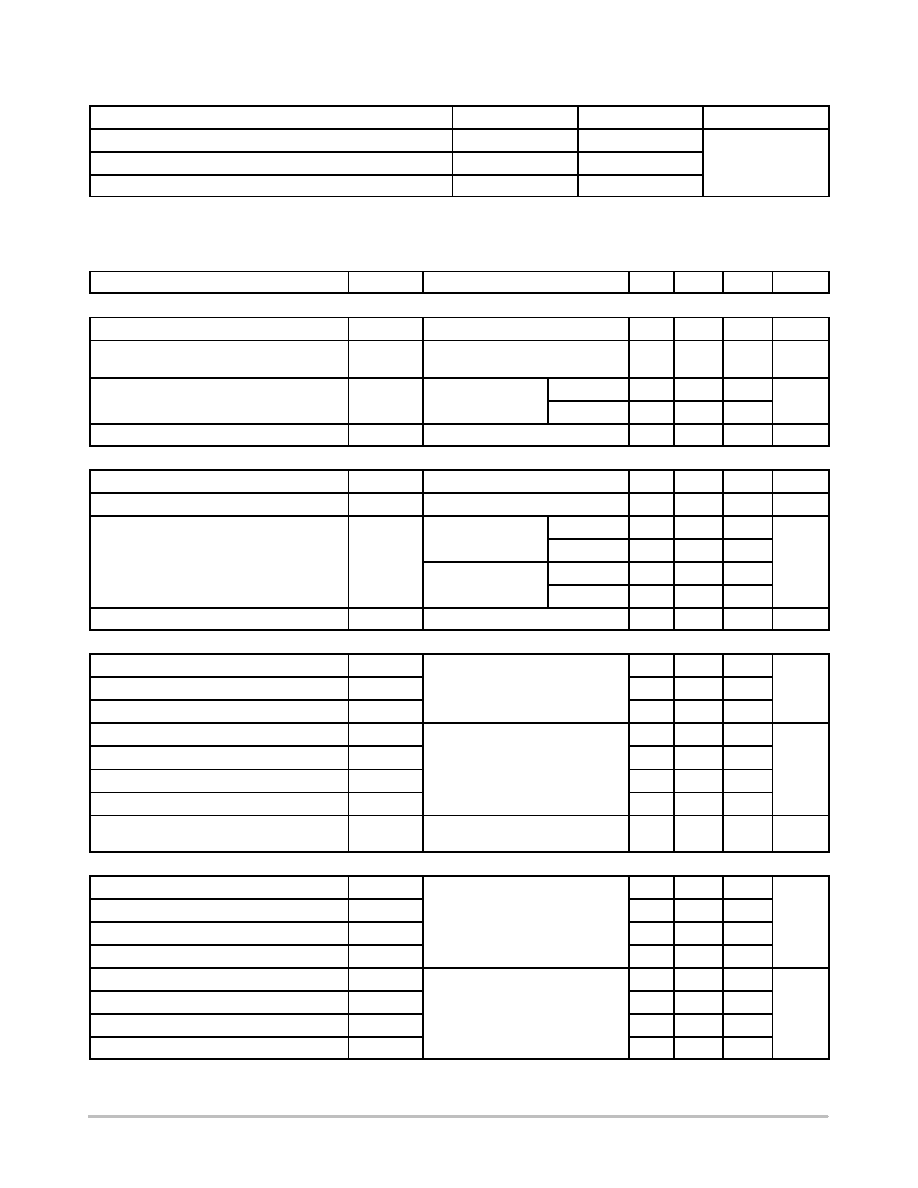
TYPICAL PERFORMANCE CURVES
3.8 V
3.0 V
60
0.003
0
35
2.0
1.0
0
1,000
100,000
0
2
1
V
DS
, DRAIN-TO-SOURCE VOLTAGE (VOLTS)
I
D
, DRAIN CURRENT (AMPS)
0
V
GS
, GATE-TO-SOURCE VOLTAGE (VOLTS)
Figure 1. On-Region Characteristics
Figure 2. Transfer Characteristics
I
D
,
DRAIN CURRENT (AMPS)
2
0.015
0
4
Figure 3. On-Resistance vs. Gate-to-Source
Voltage
V
GS
, GATE-TO-SOURCE VOLTAGE (VOLTS)
Figure 4. On-Resistance vs. Drain Current and
Gate Voltage
I
D
, DRAIN CURRENT (AMPS)
R
DS(on)
, DRAIN-T
O-SOURCE
RESIST
ANCE
(
W
)
R
DS(on)
, DRAIN-T
O-SOURCE
RESIST
ANCE
(
W
)
Figure 5. On-Resistance Variation with
Temperature
T
J
, JUNCTION TEMPERATURE (
∞
C)
Figure 6. Drain-to-Source Leakage Current
vs. Voltage
V
DS
, DRAIN-TO-SOURCE VOLTAGE (VOLTS)
R
DS(on)
, DRAIN-T
O-SOURCE
RESIST
ANCE
(NORMALIZED)
I
DSS
, LEAKAGE (nA)
-50
25
0
-25
50
75
2
3
16
12
30
2
3
V
DS
10 V
T
J
= 25
∞
C
T
J
= -55
∞
C
T
J
= 125
∞
C
V
GS
= 4.5 V
125
V
GS
= 0 V
I
D
= 30 A
V
GS
= 10 V
T
J
= 150
∞
C
4
6
T
J
= 25
∞
C
20
V
GS
= 5 to 6 V
100
4
0
6
15
0.001
20
3.4 V
3.2 V
3.6 V
40
20
200
I
D
= 30 A
T
J
= 25
∞
C
8
V
GS
= 11.5 V
100
T
J
= 25
∞
C
0.002
10
5
1
10
12
0.004
24
60
80
100
120
140
0.005
0.010
0.020
40
50
45
1.5
0.5
T
J
= 125
∞
C
150
0.030
10,000
8
180
4.0 V
5
0.025
0.007
0.005
0.006
25
30
55
10
28
160
4.2 V
0
40
20
200
60
80
100
120
140
180
160
4
NTMFS4834N
http://onsemi.com
5
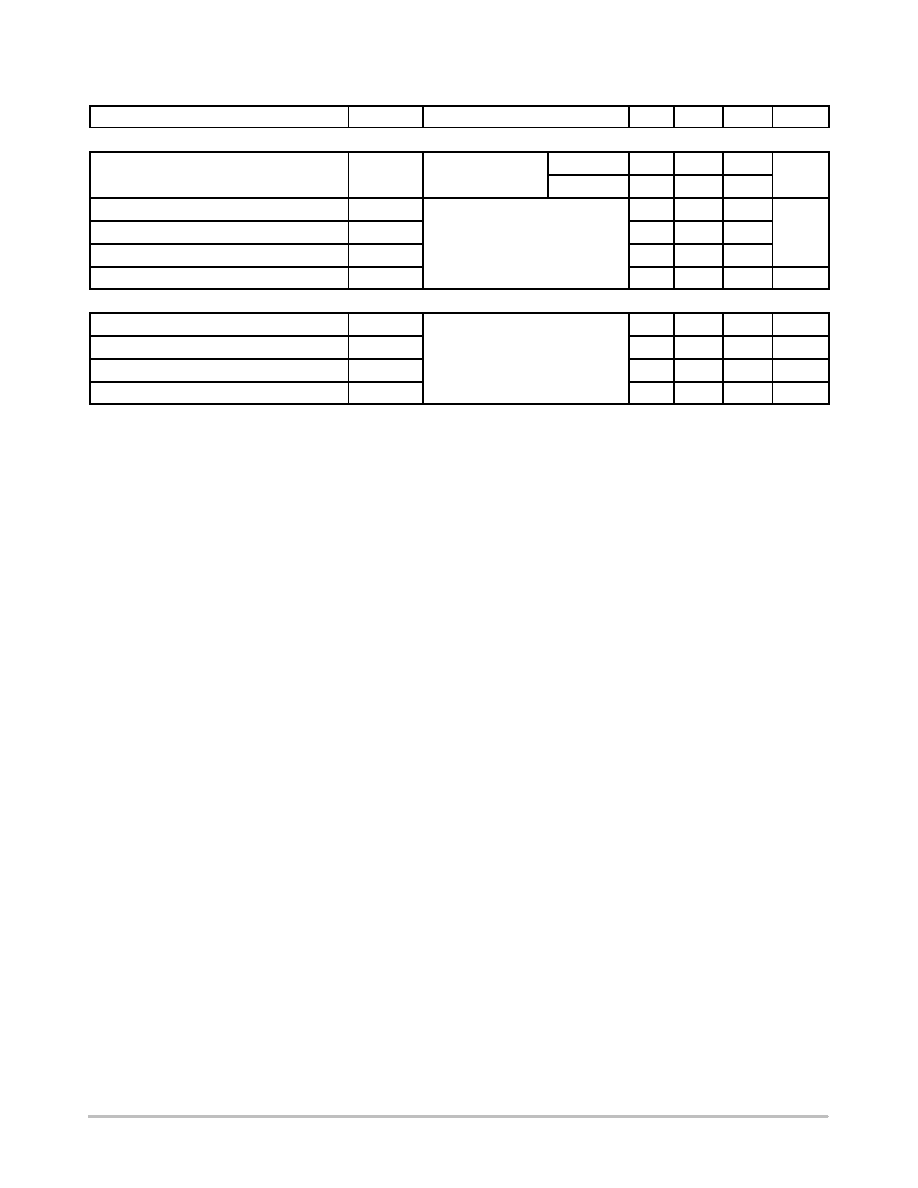
TYPICAL PERFORMANCE CURVES
t
r
t
d(off)
t
d(on)
t
f
V
GS
-15
0
10
15
GATE-TO-SOURCE OR DRAIN-TO-SOURCE VOLTAGE (VOLTS)
C, CAP
ACIT
ANCE
(pF)
Figure 7. Capacitance Variation
3500
0
V
GS
V
DS
-5
5
T
J
= 25
∞
C
C
iss
C
oss
C
rss
C
iss
Figure 8. Gate-To-Source and Drain-To-Source
Voltage vs. Total Charge
0
4
0
Q
G
, TOTAL GATE CHARGE (nC)
2
8
30
I
D
= 30 A
T
J
= 25
∞
C
Q
T
35
0
V
SD
, SOURCE-TO-DRAIN VOLTAGE (VOLTS)
I S
, SOURCE CURRENT
(AMPS)
Figure 9. Resistive Switching Time
Variation vs. Gate Resistance
R
G
, GATE RESISTANCE (
W
)
1
10
100
1000
t, TIME
(ns)
V
GS
= 0 V
Figure 10. Diode Forward Voltage vs. Current
100
0.5
0.6
5
10
15
1
V
DS
= 15 V
I
D
= 15 A
V
GS
= 11.5 V
0.7
0.8
20
30
25
T
J
= 25
∞
C
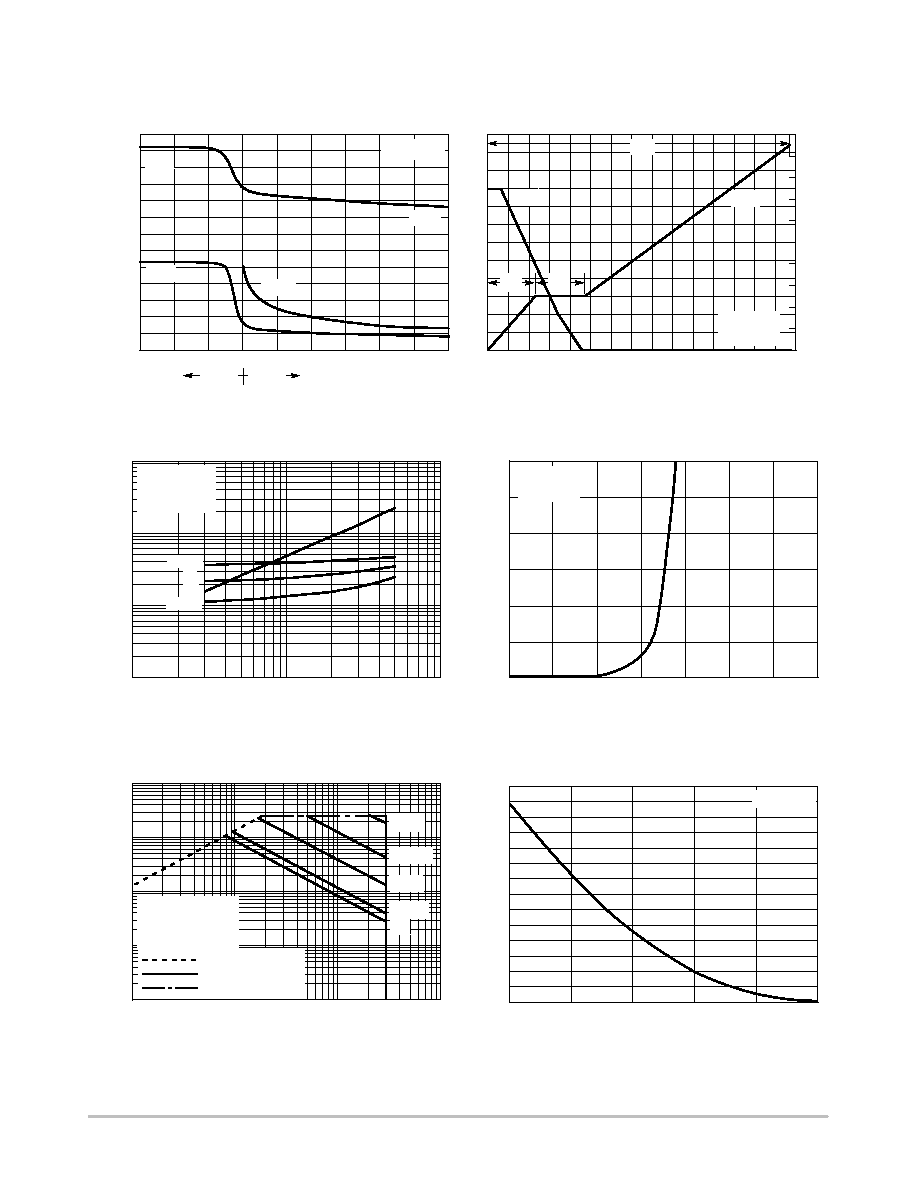
Figure 11. Maximum Rated Forward Biased
Safe Operating Area
0.1
1
100
V
DS
, DRAIN-TO-SOURCE VOLTAGE (VOLTS)
1000
I D
, DRAIN CURRENT
(AMPS)
R
DS(on)
LIMIT
THERMAL LIMIT
PACKAGE LIMIT
10
10
V
GS
= 20 V
SINGLE PULSE
T
C
= 25
∞
C
1 ms
100
m
s
10 ms
dc
10
m
s
20
1
100
0
25
T
J
, STARTING JUNCTION TEMPERATURE (
∞
C)
I
D
= 32 A
Figure 12. Maximum Avalanche Energy vs.
Starting Junction Temperature
50
75
120
100
125
200
560
E
AS
,
SINGLE PULSE DRAIN-T
O-SOURCE
A
V
ALANCHE ENERGY (mJ)
150
500
40
30
6500
3000
2500
1500
1000
0.4
1.1
V
GS
,
G
A
TE-T
O-SOURCE
VOL
T
AGE
(VOL
TS
)
6
20
10
25
50
45
40
Q
gs
320
360
12
75
4500
10
Q
gd
0.1
80
160
240
280
-10
25
2000
4000
15
5
20
18
16
14
12
10
8
6
4
2
0
V
DS
,
DRAIN-T
O-SOURCE VOL
T
AGE
(VOL
TS)
V
DS
10
0.9
1.0
5000
5500
6000
55 60 65 70
400
440
480
520