 | –≠–ª–µ–∫—Ç—Ä–æ–Ω–Ω—ã–π –∫–æ–º–ø–æ–Ω–µ–Ω—Ç: ISD2311 | –°–∫–∞—á–∞—Ç—å:  PDF PDF  ZIP ZIP |

2000 Infineon Technologies Corp. ∑ Optoelectronics Division ∑ San Jose, CA
www.infineon.com/opto ∑ 1-888-Infineon (1-888-463-4636)
OSRAM Opto Semiconductors GmbH & Co. OHG ∑ Regensburg, Germany
www.osram-os.com ∑ +49-941-202-7178
1
March 23, 2000-17
FEATURES
∑ Four Dot Matrix Characters
∑ Character Height
ISD201X--0.150"
ISD231X/235X--0.200"
∑ ISD201X/231X, Four Colors: Red, Yellow,
High Efficiency Red, High Efficiency Green
∑ ISD235X, Three Colors: Yellow, High
Efficiency Red, High Efficiency Green
∑ Wide Viewing Angle
∑ Built-in CMOS Shift Registers with Constant Current
LED Row Drivers
∑ Shift Registers Allow Custom Fonts
∑ Easily Cascaded for Multiple Displays
∑ TTL Compatible
∑ End Stackable
∑ Operating Temperature Range:
≠55
∞
C to +100
∞
C
∑ Categorized for Luminous Intensity
∑ Ceramic Package, Hermetically Sealed Flat Glass
Window
ISD201X
ISD231X
ISD235X
RED
ISD2010/2310
YELLOW
ISD2011/2311/2351
HIGH EFFICIENCY RED
ISD2012/2312/2352
HIGH EFFICIENCY GREEN
ISD2013/2313/2353
4-Character 5 x 7 Dot Matrix
Serial Input Alphanumeric Industrial Display
Sunlight Viewable: ISD235X
DESCRIPTION
The ISD201X/231X/235X are four digit 5 x 7 dot matrix serial
input alphanumeric displays. The displays are available in red,
yellow, high efficiency red, or high efficiency green. The pack-
age is a standard twelve-pin hermetic DIP with glass lens. The
display can be stacked horizontally or vertically to form mes-
sages of any length.
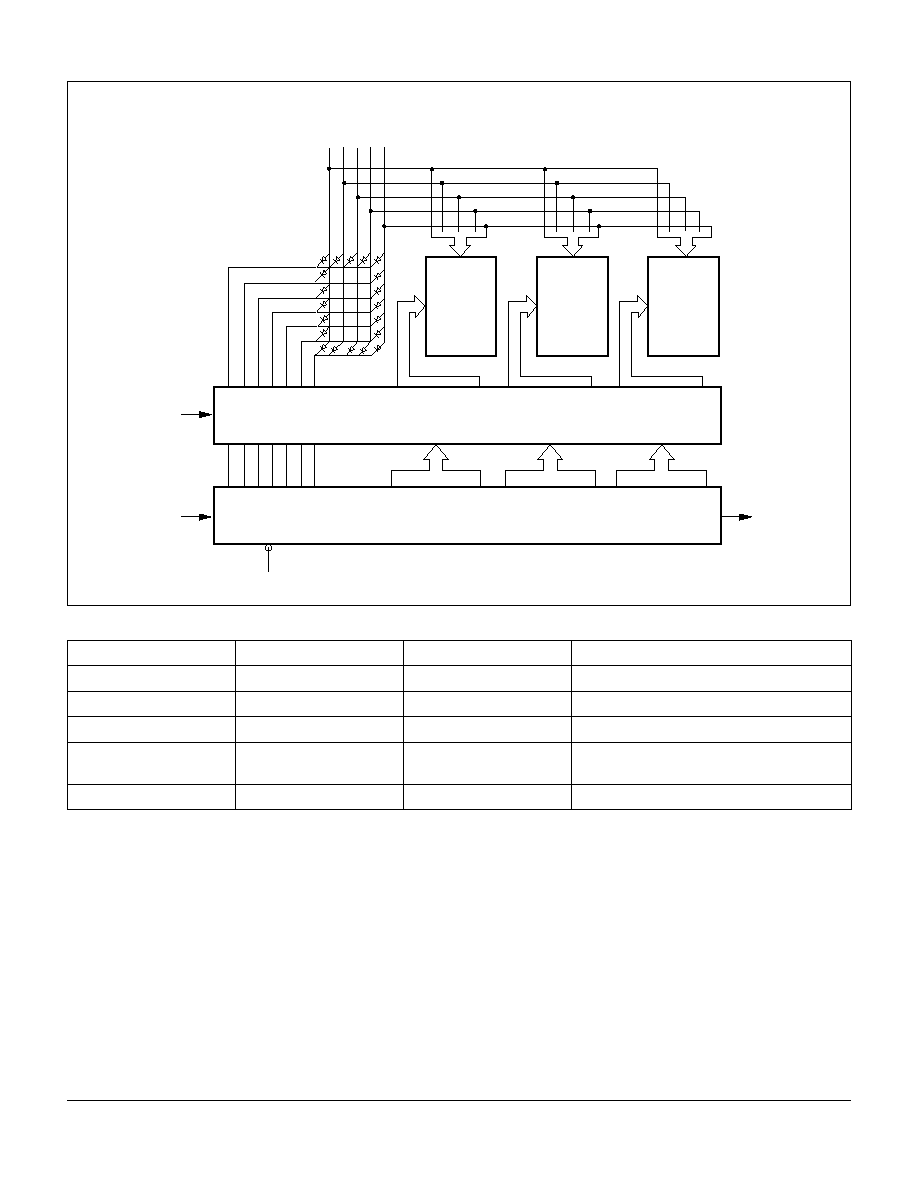
These displays have two fourteen-bit CMOS shift registers
with built-in row drivers. These shift registers drive twenty-
eight rows and enable the design of customized fonts. Cascad-
ing multiple displays is possible because of the Data In and
Data Out pins. Data In and Out are easily input with the clock
signal and displayed in parallel on the row drivers. Data Out
represents the output of the 7th bit of digit number four shift
register. The shift register is level triggered. The like columns
of each character in a display cluster are tied to a single pin
(see Block Diagram). High true data in the shift register enables
the output current mirror driver stage associated with each row
of LEDs in the 5 x 7 diode array.
The TTL compatible V
B
input may either be tied to
V
CC
for max-
imum display intensity or pulse width modulated to achieve
intensity control and reduce power consumption.
2000 Infineon Technologies Corp. ∑ Optoelectronics Division ∑ San Jose, CA
ISD201X/231X/235X
www.infineon.com/opto ∑ 1-888-Infineon (1-888-463-4636)
OSRAM Opto Semiconductors GmbH & Co. OHG ∑ Regensburg, Germany
www.osram-os.com ∑ +49-941-202-7178
2
March 23, 2000-17
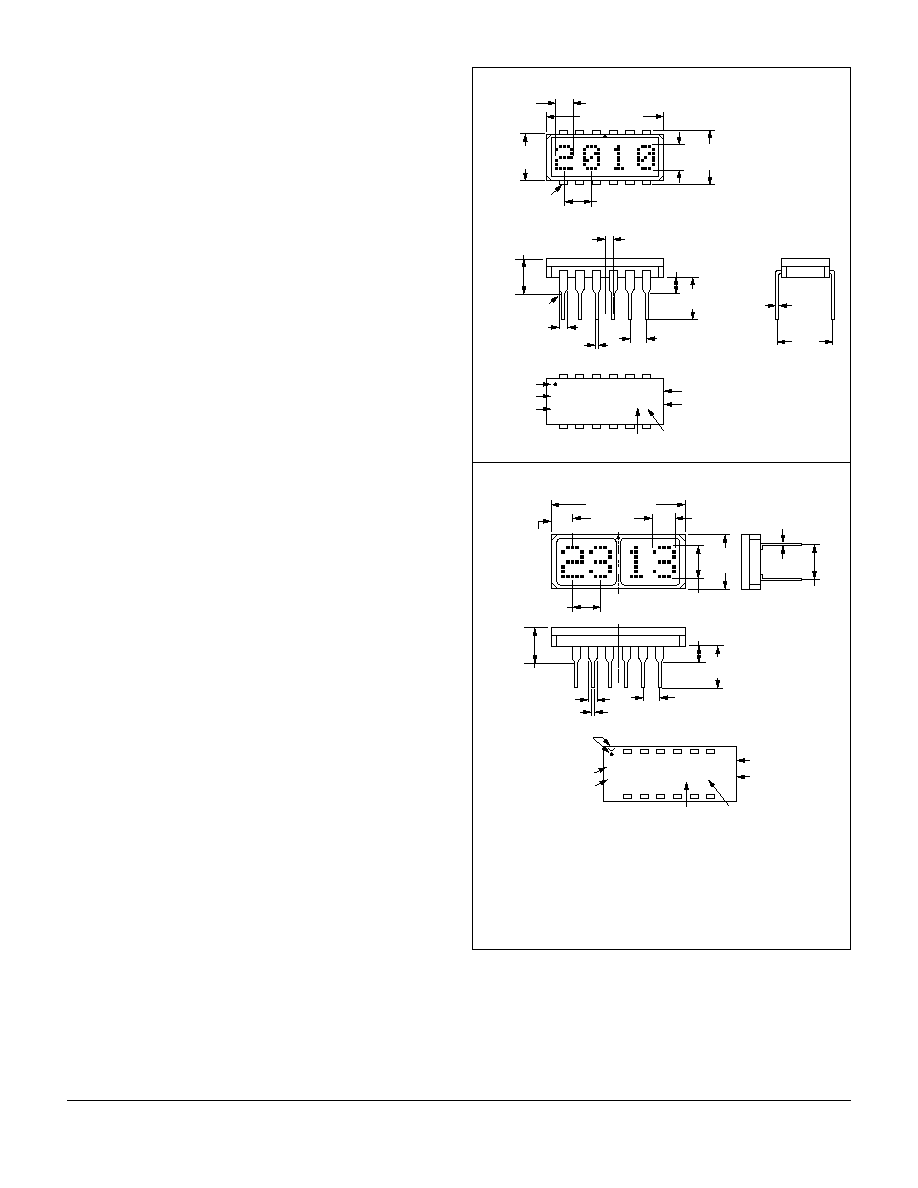
.200
(5.08)
.100
(2.54)
.270
(6.85)
.050 (1.27)
±
.005 (.13)
.100 (2.54) typ.
±
.005 (.13)
10 pl., non-cum.
.020 (.54)
±
.003 (.08)
.050 (1.27)
12 pl.
Seating
Plane
ISD201X
Z H
YYWW
Pin 1
Indicator
Year
Work
Week
Hue Code
Luminous
Intensity Code
OSRAM
Part Number
.010
(.25)
±
.002
(.05)
typ.
.300
(7.62)
.699 (17.7)
max.
.083
(2.11)
.310
(7.87)
.290
(7.25)
.175 (4.44)
±
.005 (.13)
Pin 1
marked by
dot on back
of package
.146
(3.7)
Pin
Function
Pin
Function
1
Column 1
7
Data Out
2
Column 2
8
VB
3
Column 3
9
V
CC
4
Column 4
10
Clock
5
Column 5
11
Ground
6
No connection
12
Data In
.200
(5.08)
Pin 1 indicators
dot and notch on
package underside
.100
(2.54)
.270
(6.86)
.100 (2.54)
±
.005 (.13)
non-cum. 10 pl.
.020 (.51)
±
.003 (.08)
.050
(1.27)
12 pl.
ISD231X
Z H
YYWW
Year
Work Week
Hue Code
Luminous
Intensity Code
OSRAM
Part No.
.010 (.25)
±
.002 (.05)
.250 (6.35)
±
.010 (.25)
CL
.790 (20.07)
max.
.112
(2.84)
.332
(8.43)
.197 (5.00)
±
.005 (.13)
.192
(4.88)
12 11 10 9 8 7
1 2 3 4 5 6
.099
(2.51)
±
.005
(.13)
Dimensions in Inches (mm)
ISD231X/235X
ISD201X
DESCRIPTION
(continued)
In the normal mode of operation, input data for digit four, col-
umn one is loaded into the seven on-board shift register
locations one through seven. Column one data for digits 3, 2,
and 1 is shifted into the display shift register locations. Then
column one input is enabled for an appropriate period of
time, T. A similar process is repeated for columns 2, 3, 4,
and 5. If the decode time and load data time into the shift
register is t, then with five columns, each column of the dis-
play is operating at a duty factor of:
T+t, allotted to each display column, is generally chosen to
provide the maximum duty factor consistent with the mini-
mum refresh rate necessary to achieve a flicker free display.
For most strobed display systems, each column of the display
should be refreshed (turned on) at a minimum rate of 100
times per second.
With columns to be addressed, this refresh rate then gives a
value for the time T+t of: 1/ [5 x (100)]=2.0 msec. If the
device is operated at 5.0 MHz clock rate maximum, it is possi-
ble to maintain t<T. For short display strings, the duty factor
will then approach 20%.
See Appnote 44 for application information and Appnotes 18,
19, 22, 23 at www.infineon.com/opto.
Maximum Ratings
Supply Voltage
V
CC
to GND ...............................≠0.5 V to +7.0 V
Inputs, Data Out and V
B
.............................≠0.5 V to
V
CC
+0.5 V
Column Input Voltage,
V
COL
.............................≠0.5 V to +6.0 V
Operating Temperature Range ....................... ≠55
∞
C to +100
∞
C
Storage Temperature Range ........................... ≠65
∞
C to +125
∞
C
Maximum Solder Temperature, 0.063" (1.59 mm)
below Seating Plane, t<5.0 s ........................................ 260
∞
C
Maximum Allowable Power Dissipation,
T
A
=25
∞
C
(2)
ISD2010 .......................................................................0.91 W
ISD2011/2/3 .................................................................0.86 W
ISD231X .........................................................................1.1 W
ISD235X .......................................................................1.35 W
Notes:
1)
Operation above +100
∞
C ambient is possible if the following
conditions are met. The junction should not exceed
T
J
=125
∞
C
and the case temperature (as measured at pin 1 or the back of
the display) should not exceed TC=100
∞
C.
2)
Maximum allowable dissipation is derived from
V
CC
=5.25 V,
V
B
=2.4 V,
V
COL
=3.5 V 20 LEDs on per character, 20% DF.
DF
T
5 T
1
+
(
)
---------------------
=
2000 Infineon Technologies Corp. ∑ Optoelectronics Division ∑ San Jose, CA
ISD201X/231X/235X
www.infineon.com/opto ∑ 1-888-Infineon (1-888-463-4636)
OSRAM Opto Semiconductors GmbH & Co. OHG ∑ Regensburg, Germany
www.osram-os.com ∑ +49-941-202-7178
3
March 23, 2000-17
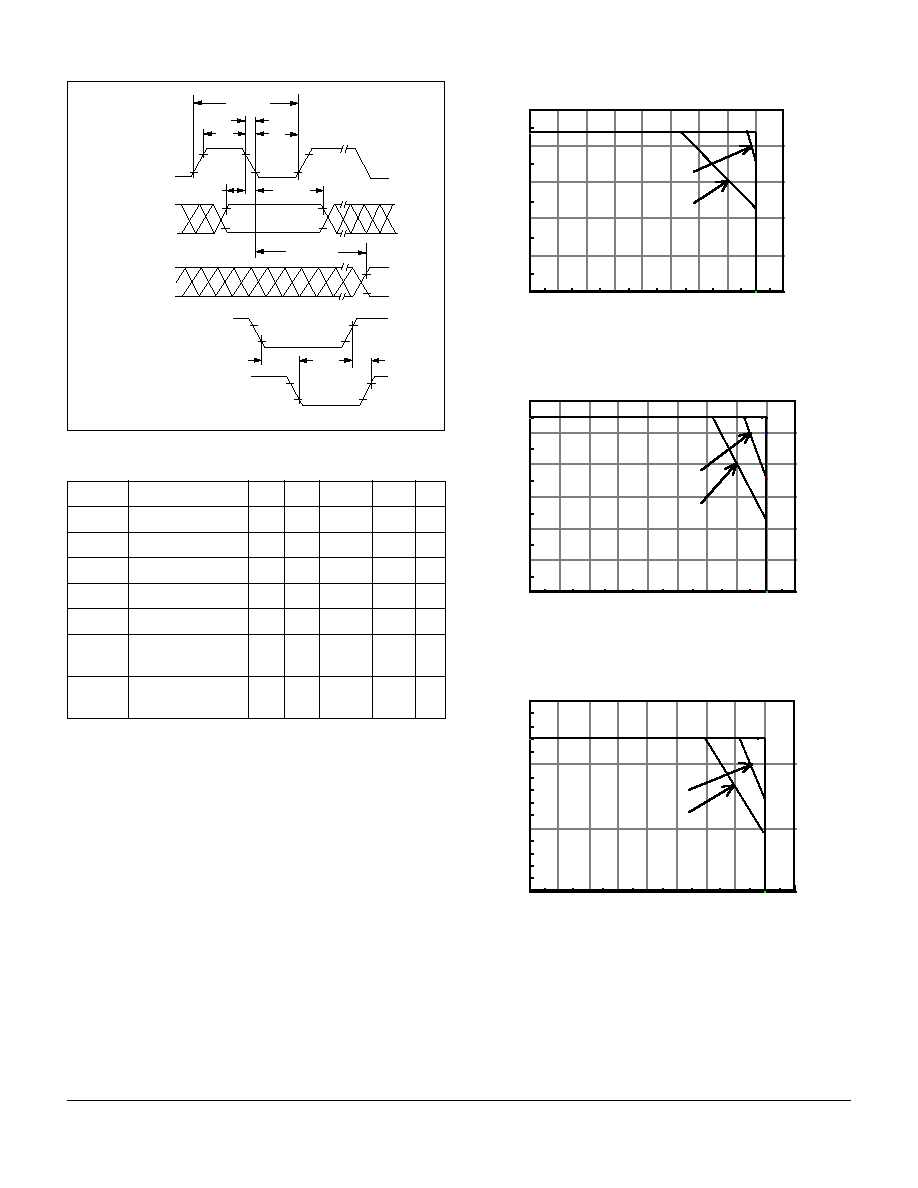
Figure 1. Timing Characteristics
AC Electrical Characteristics
(
V
CC
=4.75 to 5.25 V,
T
A
=≠55
∞
C to 100
∞
C)
Notes:
1)
All typical values specified at
V
CC
=5.0 V and
T
A
=25
∞
C unless
otherwise noted.
2)
V
B
Pulse Width Frequency--50 kHz (max.)
Symbol Description
Min. Typ. Max.
(1)
Units Fig.
T
SETUP
Setup Time
50
10
--
ns
1
T
HOLD
Hold Time
25
20
--
ns
1
T
WL
Clock Width Low
75
45
--
ns
1
T
WH
Clock Width High
75
45
--
ns
1
F
(CLK)
Clock Frequency
--
--
5
MHz
1
T
THL
T
TLH
Clock Transition
Time
--
75
200
ns
1
T
PHL
T
PLH
Propagation Delay
Clock to Data Out
--
50
125
ns
1
T
WL
l/f
CLOCK
T
PLH
, T
PHL
T
THL
CLOCK
DATA IN
DATA OUT
T
HOLD
T
SETUP
T
WH
T
ON
T
OFF
2.4 V
0.4 V
2.0 V
0.8 V
2.0 V
0.8 V
2.0 V
0.8 V
V
IH
V
IL
V
IH
V
IL
V
IH
V
IL
V
B
V
OH
V
OL
DISPLAY
ON (illuminated)
OFF (not illuminated)
90%
10%
Figure 2. Maximum Allowable Power Dissipation
vs. Temperature, ISD201X
Figure 3. Maximum Allowable Power Dissipation
vs. Temperature, ISD231X
Figure 4. Maximum Allowable Power Dissipation
vs. Temperature, ISD235X
120
100
80
60
40
20
0
-20
-40
-60
0.0
0.2
0.4
0.6
0.8
1.0
Ta - Ambient Temperature - ∞C
PD - Maximum Allowable
Power Dissipation - W
Tj(MAX) = 125∞C
Rth(JA) = 55∞C/W
Rth(JA) = 35∞C/W
120
100
80
60
40
20
0
-20
-40
-60
0.0
0.2
0.4
0.6
0.8
1.0
1.2
Ta - Ambient Temperature - ∞C
PD - Maximum Allowable
Power Dissipation - W
Rth(JA) = 35∞C/W
Rth(JA) = 55∞C/W
Tj(MAX) = 125∞C
120
100
80
60
40
20
0
-20
-40
-60
0.0
0.5
1.0
1.5
Ta - Ambient Temperature - ∞C
PD - Maximum Allowable
Power Dissipation - W
Rth(JA) = 35∞C/W
Rth(JA) = 55∞C/W
Tj(MAX) = 125∞C

2000 Infineon Technologies Corp. ∑ Optoelectronics Division ∑ San Jose, CA
ISD201X/231X/235X
www.infineon.com/opto ∑ 1-888-Infineon (1-888-463-4636)
OSRAM Opto Semiconductors GmbH & Co. OHG ∑ Regensburg, Germany
www.osram-os.com ∑ +49-941-202-7178
4
March 23, 2000-17
Optical Characteristics
Red ISD2010, ISD2310
Yellow ISD2011, IDS2311, ISD2351
High Efficiency Red IDS2012, ISD2312, IDS2352
High Efficiency Green IDS2013, ISD2313, IDS2353
Notes:
1)
The displays are categorized for luminous intensity with the intensity category designated by a letter code on the bottom of the package.
2)
Dominant wavelength (
dom
) is derived from the CIE chromaticity diagram and represents the single wavelength which defines the color
of the device.
3)
The luminous sterance of the LED may be calculated using the following relationships:
L
V
(cd/m
2
) =
l
V
(Candela)/A (Meter)
2
L
V
(Footlamberts) =
l
v
(Candela)/A (Foot)
2
A=5.3 x 10
≠8
m
2
= 5.8 x10
≠7
(Foot)
2
4)
All typical values specified at
V
CC
=5.0 V and
T
A
=25
∞
C unless otherwise noted.
5)
The luminous intensity is measured at
T
A
=
T
J
=25
∞
C. No time is allowed for the device to warm up prior to measurement.
Description
Symbol
Min.
Typ.
(4)
Units
Test Conditions
Peak Luminous Intensity per LED
(1,3)
(Character Average)
ISD2010
I
V
peak
105
200
µ
cd
V
CC
=5.0 V,
V
COL
=3.5 V
T
J
=25
∞
C
(5)
, V
B
=2.4 V
ISD2310
220
370
Peak Wavelength
V
peak
--
660
nm
--
Dominant Wavelength
(2)
dom
--
639
nm
--
Description
Symbol
Min.
Typ.
(4)
Units
Test Conditions
Peak Luminous Intensity per LED
(1,3)
(Character Average)
ISD2011
I
V
peak
400
750
µ
cd
V
CC
=5.0 V,
V
COL
=3.5 V
T
J
=25
∞
C
(5)
, V
B
=2.4 V
ISD2311
650
1140
ISD2351
2400
3400
Peak Wavelength
V
peak
--
583
nm
--
Dominant Wavelength
(2)
dom
--
585
nm
--
Description
Symbol
Min.
Typ.
(4)
Units
Test Conditions
Peak Luminous Intensity per LED
(1,3)
(Character Average)
ISD2012
I
V
peak
400
1430
µ
cd
V
CC
=5.0 V,
V
COL
=3.5 V
T
J
=25
∞
C
(5)
, V
B
=2.4 V
ISD2312
650
1430
ISD2352
853
2500
Peak Wavelength
V
peak
--
630
nm
--
Dominant Wavelength
(2)
dom
--
626
nm
--
Description
Symbol
Min.
Typ.
(4)
Units
Test Conditions
Peak Luminous Intensity per LED
(1,3)
(Character Average)
ISD2013
I
V
peak
850
1550
µ
cd
V
CC
=5.0 V,
V
COL
=3.5 V
T
J
=25
∞
C
(5)
, V
B
=2.4 V
ISD2313
1280
2410
ISD2353
2400
3000
Peak Wavelength
V
peak
--
568
nm
--
Dominant Wavelength
(2)
dom
--
574
nm
--

2000 Infineon Technologies Corp. ∑ Optoelectronics Division ∑ San Jose, CA
ISD201X/231X/235X
www.infineon.com/opto ∑ 1-888-Infineon (1-888-463-4636)
OSRAM Opto Semiconductors GmbH & Co. OHG ∑ Regensburg, Germany
www.osram-os.com ∑ +49-941-202-7178
5
March 23, 2000-17
Recommended Operating Conditions
(Guaranteed over operating temperature range)
Note:
1)
See Figures 5, 6 and 7: Peak column current versus column voltage
Figure 5. Peak Column Current vs. Column
Voltage, ISD201X
Figure 6. Peak Column Current vs. Column
Voltage, ISD231X
Parameter
Symbol
Min.
Nom.
Max.
Units
Supply Voltage
V
CC
4.75
5.0
5.25
V
Data Out Current, Low State
I
OL
--
--
--
mA
Data Out Current, High State
I
OH
--
--
--
mA
Column Input Voltage, Column On
(1)
V
COL
2.75
--
3.5
V
Setup Time
T
SETUP
70
45
--
ns
Hold Time
T
HOLD
30
--
--
ns
Width of Clock
T
W(CLK)
75
--
--
ns
Clock Frequency
T
CLK
--
--
5.0
MHz
Clock Transition Time
T
THL
--
--
200
ns
Free Air Operating Temperature Range
T
A
≠55
--
+100
∞
C
600
500
400
300
200
100
0
0.0 1.0 2.0 3.0 4.0 5.0 6.0
Vcol ≠ Column Voltage ≠ Volts
Icol
≠
Peak Column Current
≠
mA
2010
2011/2012/2013
600
500
400
300
200
100
0
ISD2311/2/3
ISD2310
0.0 1.0 2.0 3.0 4.0 5.0 6.0
Vcol ≠ Column Voltage ≠ Volts
Icol
≠
Column Current
≠
mA
Figure 7. Peak Column Current vs. Column
Voltage, ISD235X
600
500
400
300
200
100
0
0.0 1.0 2.0 3.0 4.0 5.0 6.0
Vcol ≠ Column Voltage ≠ Volts
Icol
≠
Peak Column Current
≠
mA
2000 Infineon Technologies Corp. ∑ Optoelectronics Division ∑ San Jose, CA
ISD201X/231X/235X
www.infineon.com/opto ∑ 1-888-Infineon (1-888-463-4636)
OSRAM Opto Semiconductors GmbH & Co. OHG ∑ Regensburg, Germany
www.osram-os.com ∑ +49-941-202-7178
6
March 23, 2000-17
Electrical Characteristics (≠55
∞
C to +100
∞
C, unless otherwise specified)
Notes:
1)
All typical values specified at V
CC
=5.0 V and T
A
=25
∞
C unless otherwise noted.
2)
See Figures 5, 6 and 7: Peak column current versus column voltage
Description
Symbol
Min.
Typ.
(1)
Max.
Units
Test Conditions
Supply Current (quiescent)
I
CC
--
--
5.0
mA
V
B
=0.4 V
V
CC
=5.25 V
V
CLK
=V
DATA
=2.4 V
All SR Stages=Logical 1
--
--
5.0
V
B
=2.4 V
Supply Current (operating)
I
CC
--
--
10
mA
F
CLK
=5.0 MHz
Column Current at Any Column Input
(2)
I
COL
--
--
10
µ
A
V
B
=0.4 V
V
CC
=5.25 V
V
COL
=3.5 V
All SR Stages=Logical 1
Column Current at Any Column Input
(2)
ISD2010 red
ISD2011/2/3: yellow, HER, green
ISD231X: red, yellow, HER, green
ISD235X: yellow, HER, green
I
COL
--
350
335
380
550
435
410
520
650
mA
--
V
B
, Clock or Data Input Threshold Low
V
IL
--
--
0.8
V
V
CC
=4.75 V≠5.25 V
V
B
, Clock or Data Input Threshold High
V
IH
2.0
--
--
V
Data Out Voltage
V
OH
2.4
3.6
--
V
I
OH
=0.5 mA
V
CC
=5.25 V
I
COL
=0 mA
V
OL
--
--
--
--
I
OL
=1.6 mA
Input Current Logical 0, V
B
only
I
IL
≠30
≠110
≠300
µ
A
V
CC
=4.75 V≠5.25 V, V
IL
=0.8 V
Input Current Logical 0, Data, Clock
I
IL
--
--
--
--
Power Dissipation per Package
ISD201X
ISD231X
ISD235X
P
D
0.44
0.52
0.74
--
--
W
V
CC
=5.0 V, V
COL
=3.5 V, 17.5% DF
15 LEDs on per character, V
B
=2.4 V
Thermal Resistance IC, Junction-to-Pin
ISD201X
ISD231X
ISD235X
R
J-PIN
--
30
20
25
--
∞
C/W/
Device
--
2000 Infineon Technologies Corp. ∑ Optoelectronics Division ∑ San Jose, CA
ISD201X/231X/235X
www.infineon.com/opto ∑ 1-888-Infineon (1-888-463-4636)
OSRAM Opto Semiconductors GmbH & Co. OHG ∑ Regensburg, Germany
www.osram-os.com ∑ +49-941-202-7178
7
March 23, 2000-17
Figure 8. Block Diagram
Contrast Enhancement Filters for Sunlight Readability
* Marks Polarized Corp.
25-B Jefryn Blvd. W.
Deer Park, NY 11729
516/242-1300
FAX 516/242-1347
Marks Polarized Corp. manufactures
to MIL-1-45208 inspection system.
Display Color
Filter Color
Marks Polarized Corp.*
Optical Characteristics of Filter
Red, HER
Red
MPC 20-15C
25% at 635 nm, Circular Polarizer
Yellow
Amber
MPC 30-25C
25% at 583 nm, Circular Polarizer
Green
Yellow/Green
MPC 50-122C
22% at 568 nm, Circular Polarizer
Multiple Colors
High Ambient Light
Neutral Gray
MPC 80-10C
10% Neutral, Circular Polarizer
Multiple Colors
Neutral Gray
MPC 80-37C
37% Neutral, Circular Polarizer
1 2 3 4 5 6 7 Rows 8-14 Rows 15-21 Rows 22-28
28-Bit SIPO Shift Register
1 2 3 4 5 6 7 Rows 1-7 Rows 1-7 Rows 1-7
Constant Current Sinking LED Drivers
Blanking
Control, V
B
Column Drive Inputs
Column
1 2 3 4 5
LED
Matrix
2
LED
Matrix
3
LED
Matrix
4
Serial
Data
Input
Clock
Serial
Data
Output
Rows

2000 Infineon Technologies Corp. ∑ Optoelectronics Division ∑ San Jose, CA
ISD201X/231X/235X
www.infineon.com/opto ∑ 1-888-Infineon (1-888-463-4636)
OSRAM Opto Semiconductors GmbH & Co. OHG ∑ Regensburg, Germany
www.osram-os.com ∑ +49-941-202-7178
8
March 23, 2000-17
The small alphanumeric displays are hybrid LED and CMOS
assemblies that are designed for reliable operation in commer-
cial and industrial environments. Optimum reliability and optical
performance will result when the junction temperature of the
LEDs and CMOS ICs are kept as low as possible.
Thermal Modeling
ISD displays consist of two driver ICs and four 5 x 7 LED
matrixes. A thermal model of the display is shown in Figure 9.
It illustrates that the junction temperature of the semiconductor
= junction self heating + the case temperature rise + the ambi-
ent temperature. Equation 1 shows this relationship.
Figure 9. Thermal Model
See Equation 1 below.
The junction rise within the LED is the product of the thermal
impedance of an individual LED (37
∞
C/W, DF=20%, F=200 Hz),
times the forward voltage, V
F(LED)
, and forward current I
F
(LED),
of 13 ≠ 14.5 mA. This rise averages T
J(LED)
=1
∞
C. The Table
below shows the V
F(LED)
for the respective displays.
The junction rise within the LED driver IC is the combination
of the power dissipated by the IC quiescent current and the
28 row driver current sinks. The IC junction rise is given in
Equation 2.
A thermal resistance of 28
∞
C/W results in a typical junction
rise of 6
∞
C.
Model Number
VF
Min.
Typ.
Max.
ISD2010
ISD2310
1.6
1.7
2.0
ISD2011/2/3
ISD2311/2/3
ISD2351/2/3
1.9
2.2
3.0
LED
T
1
IC
T
2
LED
T
1
LED
T
1
IC
T
2
LED
T
1
LED Power IC Power LED Power
LED Power
IC Power
LED Power
R
CA
R
1
R
1
R
1
R
1
R
2
R
2
See Equation 2 below.
Equation 1.
Equation 2.
T
J LED
(
)
P
LED
Z
J C
P
CASE
R
JC
R
CA
+
(
)
T
A
+
+
=
T
J LED
(
)
I
COL
28
/
(
)
V
F LED
(
)
Z
JC
[
]
n 35
/
(
)
I
COL
DF 5V
COL
(
)
V
CC
I
CC
+
[
]
R
JC
R
CA
+
[
]
T
A
+
+
=
T
J IC
( )
P
COL
R
JC
R
CA
+
(
)
T
A
+
=
T
J IC
( )
5 V
COL
V
F LED
(
)
≠
(
)
I
COL
2
/
(
)
n 35
/
(
)
DF
V
CC
I
CC
+
[
]
R
JC
R
CA
+
[
]
T
A
+
=
For ease of calculations the maximum allowable electrical oper-
ating condition is dependent upon the aggregate thermal resis-
tance of the LED matrixes and the two driver ICs. All of the
thermal management calculations are based upon the parallel
combination of these two networks which is 15
∞
C/W. Maxi-
mum allowable power dissipation is given in Equation 3.
Equation 3.
For further reference see Figures 2, 3, 4 and 11 ≠ 23.
Key to equation symbols
DF
Duty factor
I
CC
Quiescent IC current
I
COL
Column current
n
Number of LEDs on in a 5 x 7 array
P
CASE
Package power dissipation excluding LED
under consideration
P
COL
Power dissipation of a column
P
DISPLAY
Power dissipation of the display
P
LED
Power dissipation of a LED
R
CA
Thermal resistance case to ambient
R
JC
Thermal resistance junction to case
T
A
Ambient temperature
T
J(IC)
Junction temperature of an IC
T
J(LED)
Junction temperature of a LED
T
J(MAX)
Maximum junction temperature
V
CC
IC voltage
V
COL
Column voltage
V
F(LED)
Forward voltage of LED
Z
JC
Thermal impedance junction to case
Optical Considerations
The light output of the LEDs is inversely related to the LED
diode's junction temperature as shown in Figure 10. For opti-
mum light output, keep the thermal resistance of the socket or
PC board as low as possible.
P
DISPLAY
T
J MAX
(
)
T
A
≠
R
JC
R
CA
+
---------------------------------
=
P
DISPLAY
5V
COL
I
COL
n 35
/
(
)
DF
V
CC
I
CC
+
=

2000 Infineon Technologies Corp. ∑ Optoelectronics Division ∑ San Jose, CA
ISD201X/231X/235X
www.infineon.com/opto ∑ 1-888-Infineon (1-888-463-4636)
OSRAM Opto Semiconductors GmbH & Co. OHG ∑ Regensburg, Germany
www.osram-os.com ∑ +49-941-202-7178
9
March 23, 2000-17
Figure 10. Normalized Luminous Intensity vs. Junction
Temperature
When mounted in a 10
∞
C/W socket and operated at Absolute
Maximum Electrical conditions, the display will show an LED
junction rise of 17
∞
C. If T
A
=40
∞
C, then the LED's T
J
will be
57
∞
C. Under these conditions Figure 11 shows that the lV will
be 75% of its 25
∞
C value.
Figure 11. Max. LED Junction Temperature vs. Socket
Thermal Resistance
Figure 12. Max. Package Power Dissipation, ISD201X
140
120
100
80
60
40
20
0
-20
-40
-60
.1
1
10
Tj - LED Junction Temperature - ∞C
Normalized
Normalized to:
Ta = 25∞C
Luminous Intensity
50
45
40
35
30
25
20
15
10
5
0
0
5
10
15
20
25
30
35
40
45
50
Socket Thermal Resistance - ∞C/W
Tj - Delta LED Junction
Vcol = 3.5V, Icol = 410mA
Vcc =5.25V, Icc = 10mA
n = 20 LEDs, DF= 20%
P = 0.87W
Temperature - ∞C
40
35
30
25
20
15
10
5
0
0.0
0.5
1.0
1.5
LEDs on per Character
Max.
P
a
c
k
a
g
e
P
o
wer
Dissipation
-
W
Vcc = 5.25V, Icc = 10mA
Vcol = 3.5, Icol = 410mA
DF = 20%, Ta = 25
∞
C
Figure 13. Max. Package Power Dissipation, ISD231X
Figure 14. Max. Package Power Dissipation, ISD235X
Figure 15. Package Power Dissipation, ISD201X
40
35
30
25
20
15
10
5
0
0.0
0.5
1.0
1.5
2.0
LEDs on per Character
Max. Package Power Dissipation
Vcc = 5.25V, Icc =10mA
Vcol = 3.5, Icol = 520mA
DF = 20%, Ta = 25∞C
40
35
30
25
20
15
10
5
0
0.0
0.5
1.0
1.5
2.0
2.5
3.0
LEDs on per Character
Max. Package Power Dissipation
Vcc =5.25V, Icc = 10mA
Vcol = 3.5V, Icol = 600mA
DF = 20%, Ta =25∞C
40
35
30
25
20
15
10
5
0
0.0
0.5
1.0
1.5
LEDs on per Character
Package Power Dissipation - W
Vcc =5V, Icc = 5mA
Vcol = 3.5V, Icol = 335mA
DF = 20%, Ta = 25∞C

2000 Infineon Technologies Corp. ∑ Optoelectronics Division ∑ San Jose, CA
ISD201X/231X/235X
www.infineon.com/opto ∑ 1-888-Infineon (1-888-463-4636)
OSRAM Opto Semiconductors GmbH & Co. OHG ∑ Regensburg, Germany
www.osram-os.com ∑ +49-941-202-7178
10
March 23, 2000-17
Figure 16. Max. Package Power Dissipation, ISD231X
Figure 17. Max. Package Power Dissipation, ISD235X
Figure 18. Max. Character Power Dissipation, ISD201X
Figure 19. Max. Character Power Dissipation, ISD231X
40
35
30
25
20
15
10
5
0
0.0
0.5
1.0
1.5
LEDs on per Character
Package Power Dissipation - W
Vcc = 5V, Icc = 5mA
Vcol = 3.5, Icol = 380mA
DF = 20%, Ta = 25∞C
40
35
30
25
20
15
10
5
0
0.0
0.5
1.0
1.5
2.0
LEDs on per Character
Power Dissipation - W
Vcc = 5V, Icc = 5mA
Icol = 450mA, Vcol = 3.5V
DF = 20%
40
35
30
25
20
15
10
5
0
0.00
0.10
0.20
0.30
0.40
0.50
20%.
17%.
10%.
5%.
LEDs on per Character
Max Character Power Dissipation - W
Duty Factor
Vcc = 5.25V, Icc = 10mA
Vcol = 3.5V, Icol = 410mA
40
35
30
25
20
15
10
5
0
0.00
0.10
0.20
0.30
0.40
0.50
LEDs on per Character
Max. Character Power Dissipation - W
Vcc =5.25V, Icc = 10mA
Vcol = 3.5V, Icol = 380mA
20%
17%
10%
5%
Figure 20. Max. Character Power Dissipation, ISD235X
Figure 21. Character Power Dissipation, ISD201X
Figure 22. Character Power Dissipation, ISD231X
Figure 23. Character Power Dissipation, ISD235X
40
35
30
25
20
15
10
5
0
0.0
0.5
1.0
1.5
2.0
LEDs on per Character
Power Dissipation - W
Vcc = 5V, Icc = 5mA
Icol = 450mA, Vcol = 3.5V
DF = 20%
40
35
30
25
20
15
10
5
0
0.0
0.1
0.2
0.3
0.4
20%
17%
10%
5%
LEDs on per Character
Character Power Dissipation - W
Duty Factor
Vcc = 5V, Icc = 5mA
Vcol = 3.5, Icol = 335mA
40
35
30
25
20
15
10
5
0
0.0
0.1
0.2
0.3
0.4
0.5
LEDs on per Character
Character Power Dissipation - W
Vcc =5V, Icc = 5mA
Vcol = 3.5V, Icol = 380mA
20%
17%
10%
5%
40
35
30
25
20
15
10
5
0
0.0
0.1
0.2
0.3
0.4
0.5
LEDs on per Character
Character Power Dissipation - W
Vcc = 5V, Icc = 5mA
Vcol = 3.5V, Icol = 450mA
20%
17%
10%
5%