 | –≠–ª–µ–∫—Ç—Ä–æ–Ω–Ω—ã–π –∫–æ–º–ø–æ–Ω–µ–Ω—Ç: LT1E53A | –°–∫–∞—á–∞—Ç—å:  PDF PDF  ZIP ZIP |
(Notice)
°
In the absence of confirmation by device specification sheets, SHARP takes no responsibility for any defects that may occur in equipment using any SHARP
devices shown in catalogs, data books, etc. Contact SHARP in order to obtain the latest device specification sheets before using any SHARP device.
(Internet)
°
Data for sharp's optoelectronic/power device is provided for internet.(Address http://www.sharp.co.jp/ecg/)
99
LT1
t
53A series
Chip LED Device
LT1
t
53A series
s
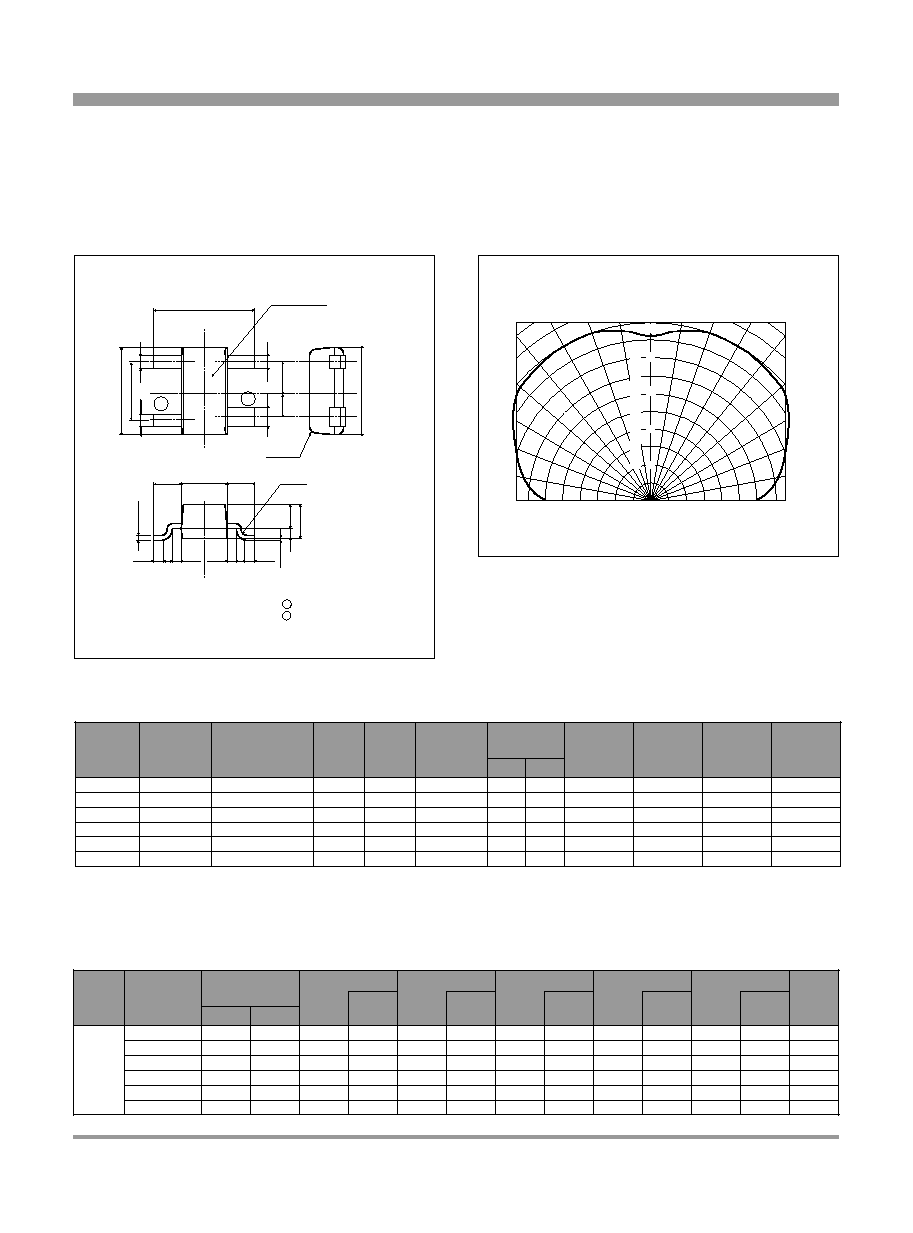
Outline Dimensions
(0.3)
(0.3)
(0.3)
(0.3)
3.3
0.9
1.5
0.9
Milky diffusion
2
.
9
2
.
9
1
.
9
0
.
4
0
.
6
0
.
3
0
.
8
0
t
o
0
.
1
5
0
.
4
0
.
4
0
.
9
5
0
.
8
5
(4-R0.2)
(R0.2)
0
.
1
6
+
0
.
1
-
0
.
0
6
1
.
1
+
0
.
2
-
0
.
1
1
2
Pin connections
Unspecified tolerance:
±
0.2
1 Anode
2 Cathode
s
Radiation Diagram
0∞
0
40
20
60
-20∞
+20∞
+40∞
+60∞
+80∞
-40∞
-60∞
-80∞
-30∞
-50∞
+10∞
100
-10∞
+30∞
+50∞
+70∞
+90∞
-90∞
-70∞
80
100
R
e
l
a
t
i
v
e
l
u
m
i
n
o
u
s
i
n
t
e
n
s
i
t
y
(
%
)
DC
Pulse
Model No. Radiation color Radiation material
Power dissipation
P
(mW)
Forward current
I
F
(mA)
Derating factor
(mA/∞C)
Peak forward current
I
FM
*1
(mA)
Operating temperature
T
opr
(∞C)
Storage temperature
T
stg
(∞C)
Soldering temperature
T
sol
*2
(∞C)
Reverse voltage
V
R
(V)
(T
a
=25∞C)
LT1P53A
LT1D53A
LT1S53A
LT1H53A
LT1E53A
LT1K53A
GaP
GaAsP on GaP
GaAsP on GaP
GaAsP on GaP
GaP
GaP
23
85
85
50
50
50
10
30
30
20
20
20
50
50
50
50
50
50
0.13
0.40
0.40
0.27
0.27
0.27
0.67
0.67
0.67
0.67
0.67
0.67
5
5
5
5
5
5
350
350
350
350
350
350
Red
Red
Sunset orange
Yellow
Yellow-green
Green
-25 to +85
-25 to +85
-25 to +100
-25 to +100
-25 to +85
-25 to +85
-25 to +100
-25 to +100
-25 to +85
-25 to +85
-25 to +100
-25 to +100
*1 Duty ratio=1/10, Pulse width=0.1ms
*2 For 3s or less at the temperature of hand soldering. Temperature of reflow soldering is shown on the below page.
s
Absolute Maximum Ratings
TYP
MAX
Model No.
Lens type
Forward voltage
V
F
(V)
p
(nm)
TYP
I
V
(mcd)
TYP
I
F
(mA)
I
F
(mA)
I
F
(mA)
(MH
Z
)
V
R
(V)
I
R
(
µ
A)
MAX
C
t
(pF)
TYP
(nm)
TYP
Peak emission wavelength
Luminous intensity
Spectrum radiation bandwidth
Reverse current
Page for
characteristics
diagrams
Terminal capacitance
(T
a
=25∞C)
LT1P53A
LT1D53A
LT1S53A
LT1H53A
LT1E53A
LT1K53A
1.9
2.0
2.0
1.9
1.95
1.85
2.3
2.8
2.8
2.5
2.5
2.5
695
635
610
585
565
555
5
20
20
10
10
10
1.4
9.6
7.8
3.7
4.8
2.2
5
20
20
10
10
10
100
35
35
30
30
25
5
20
20
10
10
10
10
10
10
10
10
10
4
4
4
4
4
4
55
20
15
35
35
40
1
1
1
1
1
1
Milky
diffusion
s
Electro-optical Characteristics
(Unit : mm)
(T
a
=25∞C)
3.3
!
2.9mm, 1.1mm Thickness,
Milky Diffusion Chip LED Devices
118
(Notice)
°
In the absence of confirmation by device specification sheets, SHARP takes no responsibility for any defects that may occur in equipment using any SHARP
devices shown in catalogs, data books, etc. Contact SHARP in order to obtain the latest device specification sheets before using any SHARP device.
(Internet)
°
Data for sharp's optoelectronic/power device is provided for internet.(Address http://www.sharp.co.jp/ecg/)
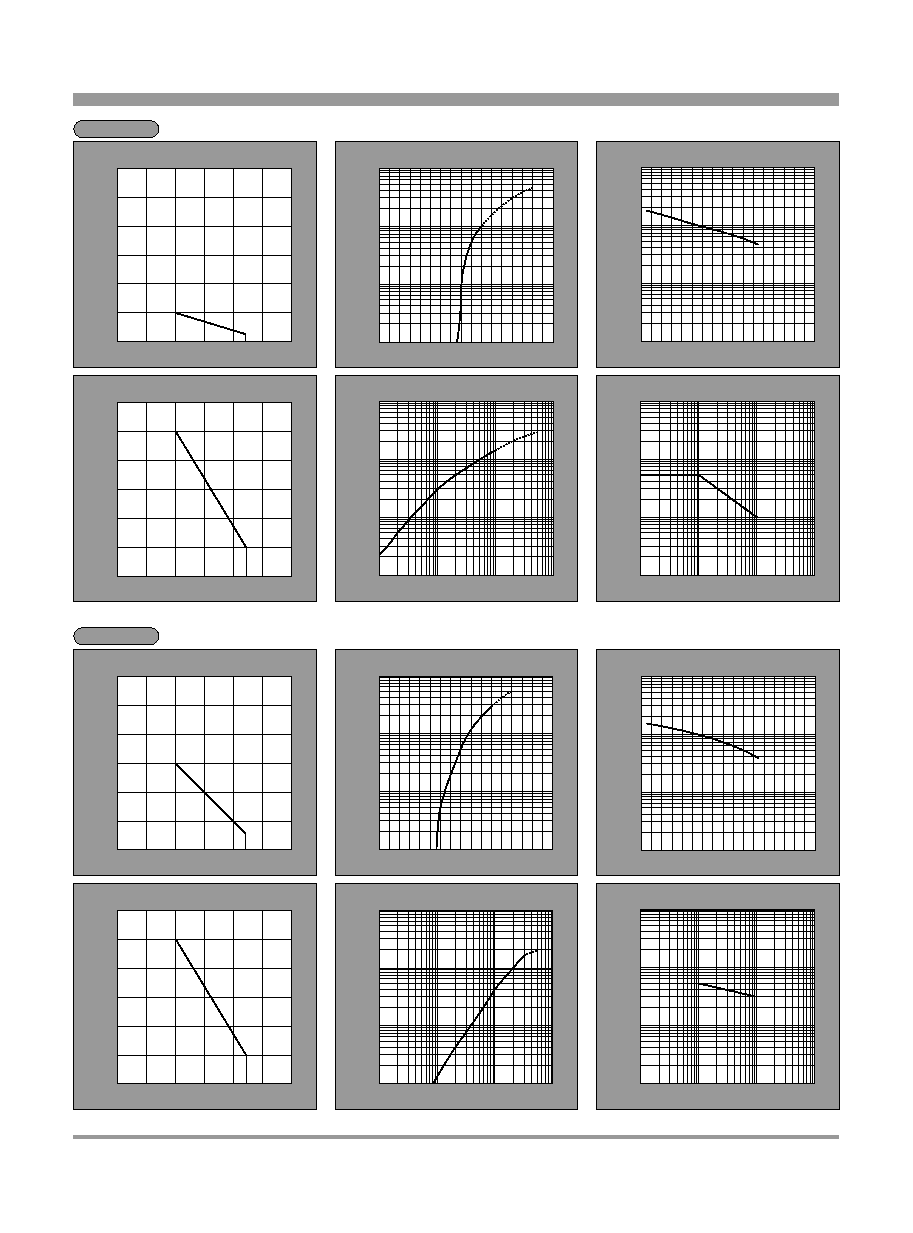
LED Lamp
Characteristics Diagrams
Note)Characteristics shown in diagrams are typical values. (not assurance value)
PR series
HD series
0
10
20
30
40
50
60
-25
0
25
50
75 85
125
100
Peak Forward Current Derating Curve
Ambient temperature T
a
(
∞C
)
P
e
a
k
f
o
r
w
a
r
d
c
u
r
r
e
n
t
I
F
M
(
m
A
)
0
10
20
30
40
50
60
-25
0
25
50
75 85
125
100
Forward Current Derating Curve
Ambient temperature T
a
(
∞C
)
F
o
r
w
a
r
d
c
u
r
r
e
n
t
I
F
(
m
A
)
0.1
0.5
1.0
5.0
10
50
100
1.0
1.2
1.4
1.6
1.8
2.0
2.4
2.6
2.2
Forward Current vs. Forward Voltage(Note)
Forward voltage V
F
(V)
F
o
r
w
a
r
d
c
u
r
r
e
n
t
I
F
(
m
A
)
(T
a=
25∞C)
1.0
5.0
10
50
100
500
1000
-20
0
20
40
60
80
120
100
Luminous Intensity vs. Ambient Temperature(Note)
Ambient temperature T
a
(
∞C
)
R
e
l
a
t
i
v
e
l
u
m
i
n
o
u
s
i
n
t
e
n
s
i
t
y
(
%
)
(T
a=
25
∞C
)
1.0
5.0
2.0
10
20
50
100
200
500
1000
0.1
0.2
0.5
1
2
5
10
20
50
Luminous Intensity vs. Forward Current(Note)
Forward current I
F
(mA)
R
e
l
a
t
i
v
e
l
u
m
i
n
o
u
s
i
n
t
e
n
s
i
t
y
(
%
)
(T
a=
25∞C)
1.0
5.0
2.0
10
20
50
100
200
500
1/50
1/20 1/10
1/5
1/2
1
Duty Ratio vs. Peak Forward Current
Duty ratio D
R
P
e
a
k
f
o
r
w
a
r
d
c
u
r
r
e
n
t
I
F
M
(
m
A
)
(T
a=
25∞C)
0
10
20
30
40
50
60
-25
0
25
50
75 85
125
100
Peak Forward Current Derating Curve
Ambient temperature T
a
(
∞C
)
P
e
a
k
f
o
r
w
a
r
d
c
u
r
r
e
n
t
I
F
M
(
m
A
)
0
10
20
30
40
50
60
-25
0
25
50
75 85
125
100
Forward Current Derating Curve
Ambient temperature T
a
(
∞C
)
F
o
r
w
a
r
d
c
u
r
r
e
n
t
I
F
(
m
A
)
0.1
0.5
1.0
5.0
10
50
100
1.0
1.2
1.4
1.6
1.8
2.0
2.4
2.6
2.2
Forward Current vs. Forward Voltage(Note)
Forward voltage V
F
(V)
F
o
r
w
a
r
d
c
u
r
r
e
n
t
I
F
(
m
A
)
(T
a=
25∞C)
1.0
5.0
10
50
100
500
1000
-20
0
20
40
60
80
120
100
Luminous Intensity vs. Ambient Temperature(Note)
Ambient temperature T
a
(
∞C
)
R
e
l
a
t
i
v
e
l
u
m
i
n
o
u
s
i
n
t
e
n
s
i
t
y
(
%
)
(T
a=
25∞C)
1.0
5.0
2.0
10
20
50
100
200
500
1000
0.1
0.2
0.5
1
2
5
10
20
50
Luminous Intensity vs. Forward Current(Note)
Forward current I
F
(mA)
R
e
l
a
t
i
v
e
l
u
m
i
n
o
u
s
i
n
t
e
n
s
i
t
y
(
%
)
(T
a=
25∞C)
1.0
5.0
2.0
10
20
50
100
200
500
1/50
1/20 1/10
1/5
1/2
1
Duty Ratio vs. Peak Forward Current
Duty ratio D
R
P
e
a
k
f
o
r
w
a
r
d
c
u
r
r
e
n
t
I
F
M
(
m
A
)
(T
a=
25∞C)
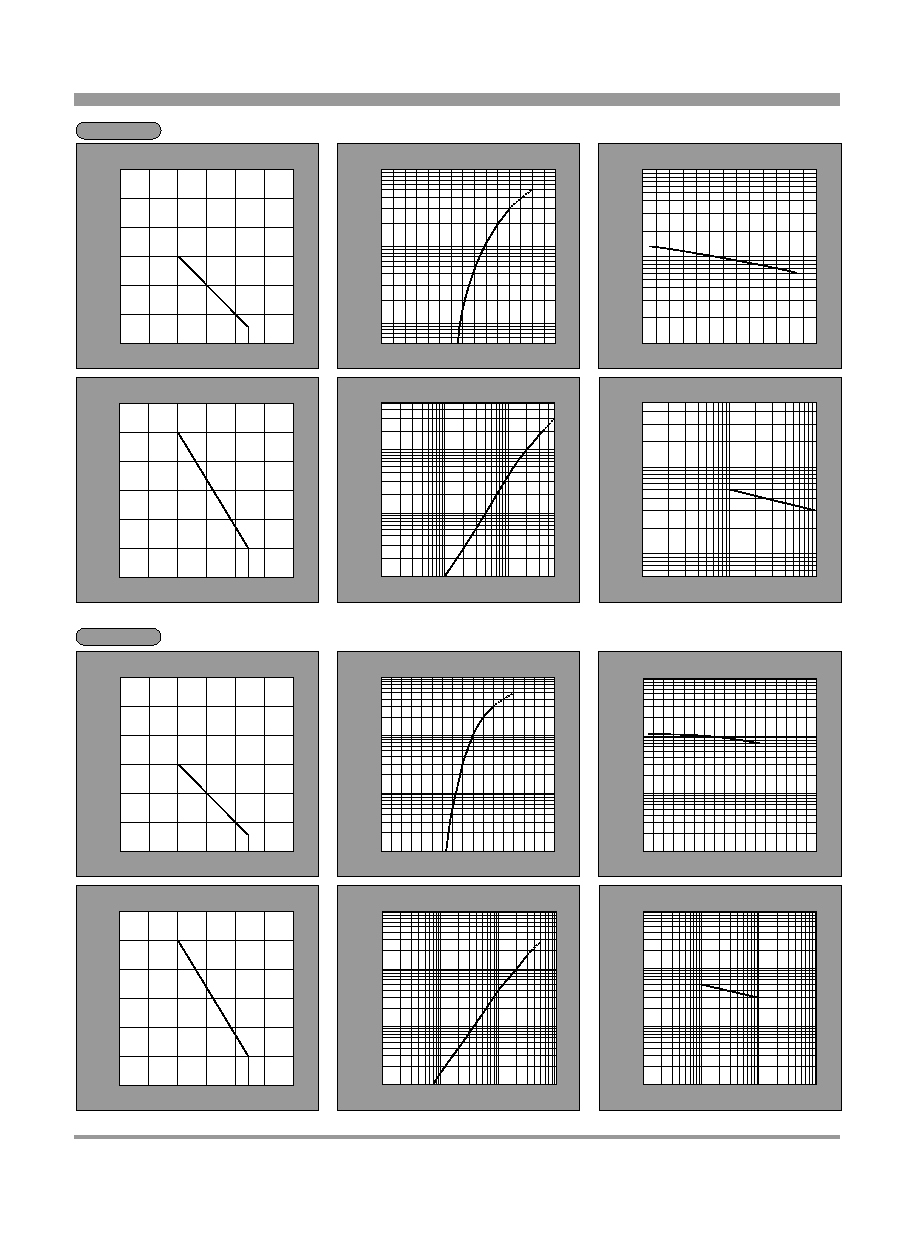
LED Lamp
Characteristics Diagrams
Note)Characteristics shown in diagrams are typical values. (not assurance value)
HS series
HY series
0.5
2
1
3
5
10
20
50
100
1.0
1.2
1.4
1.6
1.8
2.0
2.2
2.4
Forward Current vs. Forward Voltage(Note)
Forward voltage V
F
(V)
F
o
r
w
a
r
d
c
u
r
r
e
n
t
I
F
(
m
A
)
(T
a=
25∞C)
10
20
50
200
100
500
1000
-20
0
20
40
60
100
80
Luminous Intensity vs. Ambient Temperature(Note)
Ambient temperature T
a
(
∞C
)
R
e
l
a
t
i
v
e
l
u
m
i
n
o
u
s
i
n
t
e
n
s
i
t
y
(
%
)
(I
F=
20mA)
1
2
5
200
100
20
50
10
500
0.1
0.2
0.5
1
2
5
10
20
50
Luminous Intensity vs. Forward Current(Note)
Forward current I
F
(mA)
R
e
l
a
t
i
v
e
l
u
m
i
n
o
u
s
i
n
t
e
n
s
i
t
y
(
%
)
(T
a=
25∞C)
5
10
30
50
100
300
500
1/50
1/20
1/10
1/5
1/2
1
Duty Ratio vs. Peak Forward Current
Duty ratio D
R
P
e
a
k
f
o
r
w
a
r
d
c
u
r
r
e
n
t
I
F
(
m
A
)
(T
a=
25∞C)
0
10
20
30
40
50
60
-25
0
25
50
75 85
125
100
Peak Forward Current Derating Curve
Ambient temperature T
a
(
∞C
)
P
e
a
k
f
o
r
w
a
r
d
c
u
r
r
e
n
t
I
F
M
(
m
A
)
0
10
20
30
40
50
60
-25
0
25
50
75 85
125
100
Peak Forward Current Derating Curve
Ambient temperature T
a
(
∞C
)
P
e
a
k
f
o
r
w
a
r
d
c
u
r
r
e
n
t
I
F
M
(
m
A
)
0
10
20
30
40
50
60
-25
0
25
50
75 85
125
100
Forward Current Derating Curve
Ambient temperature T
a
(
∞C
)
F
o
r
w
a
r
d
c
u
r
r
e
n
t
I
F
(
m
A
)
0
10
20
30
40
50
60
-25
0
25
50
75 85
125
100
Forward Current Derating Curve
Ambient temperature T
a
(
∞C
)
F
o
r
w
a
r
d
c
u
r
r
e
n
t
I
F
(
m
A
)
0.1
0.5
1.0
5.0
10
50
100
1.0
1.2
1.4
1.6
1.8
2.0
2.4
2.6
2.2
Forward Current vs. Forward Voltage(Note)
Forward voltage V
F
(V)
F
o
r
w
a
r
d
c
u
r
r
e
n
t
I
F
(
m
A
)
(T
a=
25∞C)
1.0
5.0
10
50
100
500
1000
-20
0
20
40
60
80
120
100
Luminous Intensity vs. Ambient Temperature(Note)
Ambient temperature T
a
(
∞C
)
R
e
l
a
t
i
v
e
l
u
m
i
n
o
u
s
i
n
t
e
n
s
i
t
y
(
%
)
(T
a=
25∞C)
1.0
5.0
2.0
10
20
50
100
200
500
1000
0.1
0.2
0.5
1
2
5
10
20
50
Luminous Intensity vs. Forward Current(Note)
Forward current I
F
(mA)
R
e
l
a
t
i
v
e
l
u
m
i
n
o
u
s
i
n
t
e
n
s
i
t
y
(
%
)
(T
a=
25∞C)
1.0
5.0
2.0
10
20
50
100
200
500
1/50
1/20 1/10
1/5
1/2
1
Duty Ratio vs. Peak Forward Current
Duty ratio D
R
P
e
a
k
f
o
r
w
a
r
d
c
u
r
r
e
n
t
I
F
M
(
m
A
)
(T
a=
25∞C)
119
(Notice)
°
In the absence of confirmation by device specification sheets, SHARP takes no responsibility for any defects that may occur in equipment using any SHARP
devices shown in catalogs, data books, etc. Contact SHARP in order to obtain the latest device specification sheets before using any SHARP device.
(Internet)
°
Data for sharp's optoelectronic/power device is provided for internet.(Address http://www.sharp.co.jp/ecg/)
120
(Notice)
°
In the absence of confirmation by device specification sheets, SHARP takes no responsibility for any defects that may occur in equipment using any SHARP
devices shown in catalogs, data books, etc. Contact SHARP in order to obtain the latest device specification sheets before using any SHARP device.
(Internet)
°
Data for sharp's optoelectronic/power device is provided for internet.(Address http://www.sharp.co.jp/ecg/)
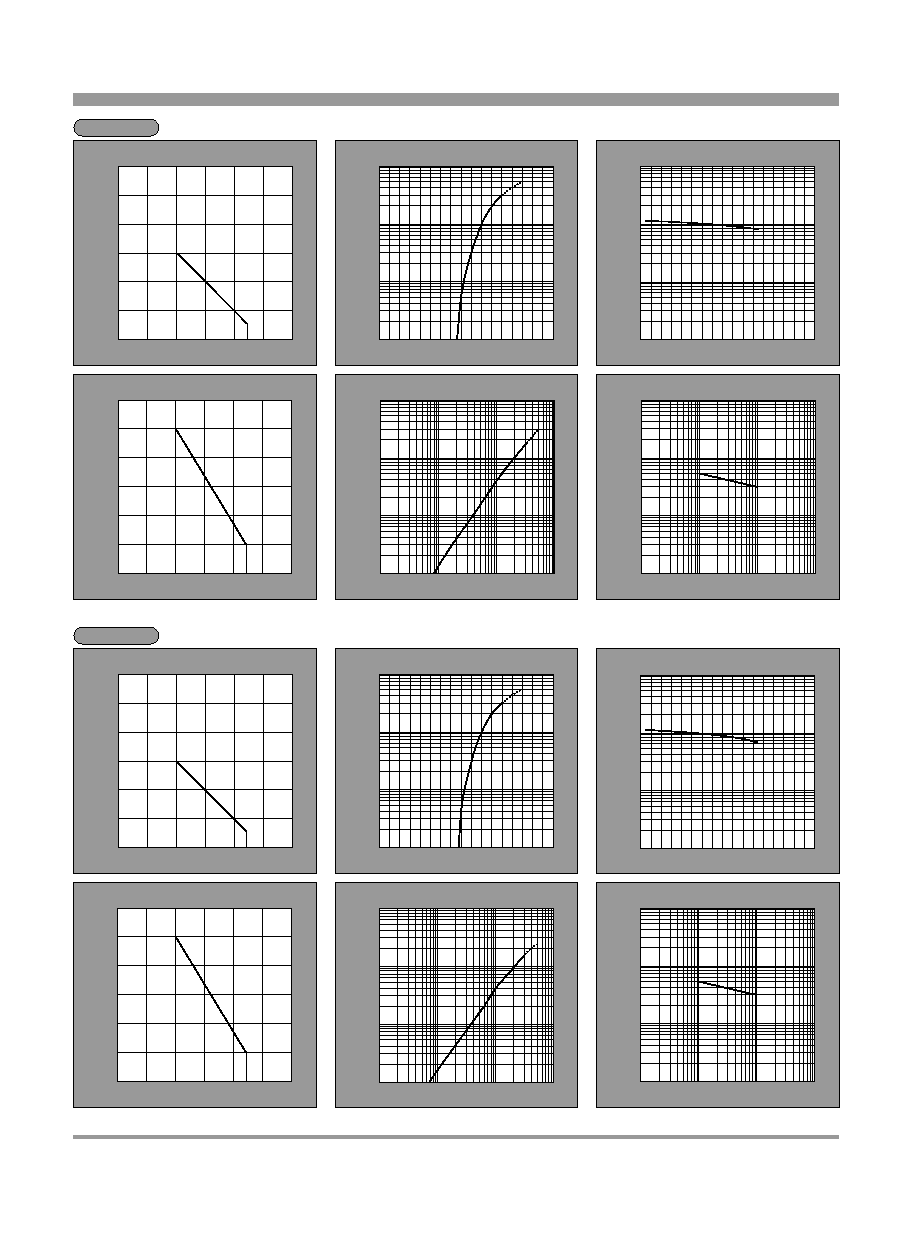
LED Lamp
Characteristics Diagrams
EG series
0
10
20
30
40
50
60
-25
0
25
50
75 85
125
100
Peak Forward Current Derating Curve
Ambient temperature T
a
(
∞C
)
P
e
a
k
f
o
r
w
a
r
d
c
u
r
r
e
n
t
I
F
M
(
m
A
)
0
10
20
30
40
50
60
-25
0
25
50
75 85
125
100
Forward Current Derating Curve
Ambient temperature T
a
(
∞C
)
F
o
r
w
a
r
d
c
u
r
r
e
n
t
I
F
(
m
A
)
0.1
0.5
1.0
5.0
10
50
100
1.0
1.2
1.4
1.6
1.8
2.0
2.4
2.6
2.2
Forward Current vs. Forward Voltage(Note)
Forward voltage V
F
(V)
F
o
r
w
a
r
d
c
u
r
r
e
n
t
I
F
(
m
A
)
(T
a=
25∞C)
1.0
5.0
10
50
100
500
1000
-20
0
20
40
60
80
120
100
Luminous Intensity vs. Ambient Temperature(Note)
Ambient temperature T
a
(
∞C
)
R
e
l
a
t
i
v
e
l
u
m
i
n
o
u
s
i
n
t
e
n
s
i
t
y
(
%
)
(T
a=
25∞C)
1.0
5.0
2.0
10
20
50
100
200
500
1000
0.1
0.2
0.5
1
2
5
10
20
50
Luminous Intensity vs. Forward Current(Note)
Forward current I
F
(mA)
R
e
l
a
t
i
v
e
l
u
m
i
n
o
u
s
i
n
t
e
n
s
i
t
y
(
%
)
(T
a=
25∞C)
1.0
5.0
2.0
10
20
50
100
200
500
1/50
1/20 1/10
1/5
1/2
1
Duty Ratio vs. Peak Forward Current
Duty ratio D
R
P
e
a
k
f
o
r
w
a
r
d
c
u
r
r
e
n
t
I
F
M
(
m
A
)
(T
a=
25∞C)
Note)Characteristics shown in diagrams are typical values. (not assurance value)
KG series
0
10
20
30
40
50
60
-25
0
25
50
75 85
125
100
Peak Forward Current Derating Curve
Ambient temperature T
a
(
∞C
)
P
e
a
k
f
o
r
w
a
r
d
c
u
r
r
e
n
t
I
F
M
(
m
A
)
0
10
20
30
40
50
60
-25
0
25
50
75 85
125
100
Forward Current Derating Curve
Ambient temperature T
a
(
∞C
)
F
o
r
w
a
r
d
c
u
r
r
e
n
t
I
F
(
m
A
)
0.1
0.5
1.0
5.0
10
50
100
1.0
1.2
1.4
1.6
1.8
2.0
2.4
2.6
2.2
Forward Current vs. Forward Voltage(Note)
Forward voltage V
F
(V)
F
o
r
w
a
r
d
c
u
r
r
e
n
t
I
F
(
m
A
)
(T
a=
25∞C)
1.0
5.0
10
50
100
500
1000
-20
0
20
40
60
80
120
100
Luminous Intensity vs. Ambient Temperature(Note)
Ambient temperature T
a
(
∞C
)
R
e
l
a
t
i
v
e
l
u
m
i
n
o
u
s
i
n
t
e
n
s
i
t
y
(
%
)
(T
a=
25∞C)
1.0
5.0
2.0
10
20
50
100
200
500
1000
0.1
0.2
0.5
1
2
5
10
20
50
Luminous Intensity vs. Forward Current(Note)
Forward current I
F
(mA)
R
e
l
a
t
i
v
e
l
u
m
i
n
o
u
s
i
n
t
e
n
s
i
t
y
(
%
)
(T
a=
25∞C)
1.0
5.0
2.0
10
20
50
100
200
500
1/50
1/20 1/10
1/5
1/2
1
Duty Ratio vs. Peak Forward Current
Duty ratio D
R
P
e
a
k
f
o
r
w
a
r
d
c
u
r
r
e
n
t
I
F
M
(
m
A
)
(T
a=
25∞C)