 | –≠–Ľ–Ķ–ļ—ā—Ä–ĺ–Ĺ–Ĺ—č–Ļ –ļ–ĺ–ľ–Ņ–ĺ–Ĺ–Ķ–Ĺ—ā: LT1EH67A | –°–ļ–į—á–į—ā—Ć:  PDF PDF  ZIP ZIP |
(Notice)
°
In the absence of confirmation by device specification sheets, SHARP takes no responsibility for any defects that may occur in equipment using any SHARP
devices shown in catalogs, data books, etc. Contact SHARP in order to obtain the latest device specification sheets before using any SHARP device.
(Internet)
°
Data for sharp's optoelectronic/power device is provided for internet.(Address http://www.sharp.co.jp/ecg/)
102
LT1
tt
67A series
Dichromatic Leadless Chip LED Device
LT1
tt
67A series
s
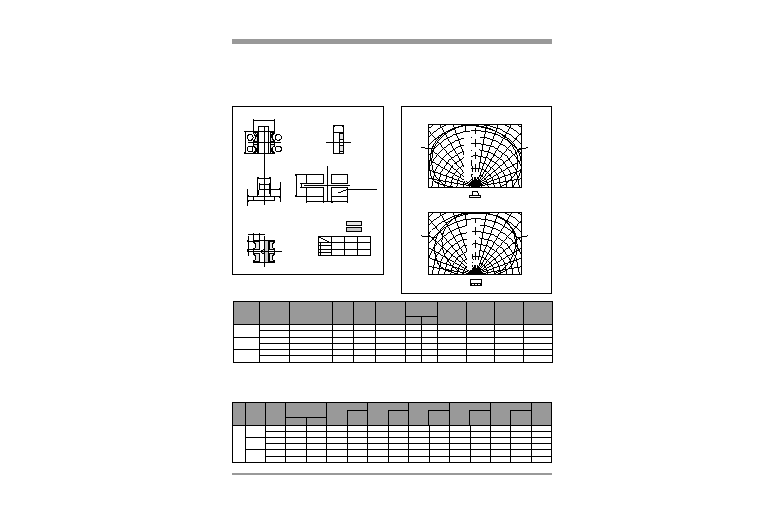
Outline Dimensions
2
1
3
4
Anode
Cathode
Cathode
Anode
1
4
3
2
KS
Green
Sunset
orange
EH
Yellow-green
Yellow
series
Pin
ED
Yellow-green
Red
Recommended PWB pattern for soldering
Soldering area
0
.
3
1
.
6
0.6
1.2 1.2
1.6
Ī
0.15
1
.
6
Ī
0
.
1
5
0
.
3
0
.
5
0.8
0.8
(0.4)
(
0
.
6
)
0.8
1.0
1.Plating area
Resist
2.Pin connections
3. Unspecified tolerance:
Ī
0.1
s
Radiation Diagram
0į
80
40
20
60
-20į +20į
+40į
+60į
+80į
-40į
-60į
-80į
0į
80
100
100
40
20
60
-20į +20į
+40į
+60į
+80į
-40į
-60į
-80į
Y
X
E.K
H.S.D
H.S.D
E.K
R
e
l
a
t
i
v
e
l
u
m
i
n
o
u
s
i
n
t
e
n
s
i
t
y
(
%
)
R
e
l
a
t
i
v
e
l
u
m
i
n
o
u
s
i
n
t
e
n
s
i
t
y
(
%
)
DC
Pulse
Model No. Radiation color Radiation material
Power dissipation
P
(mW)
Forward current
I
F
(mA)
Derating factor
(mA/įC)
Peak forward current
I
FM
*2
(mA)
Operating temperature
T
opr
(įC)
Storage temperature
T
stg
(įC)
Soldering temperature
T
sol
*3
(įC)
Reverse voltage
V
R
(V)
(T
a
=25įC)
LT1EH67A
LT1KS67A
LT1ED67A
GaP
GaAsP on GaP
GaP
GaAsP on GaP
GaP
GaAsP on GaP
84
84
84
84
84
84
30
30
30
30
30
30
50
50
50
50
50
50
0.40
0.40
0.40
0.40
0.40
0.40
0.67
0.67
0.67
0.67
0.67
0.67
5
5
5
5
5
5
350
350
350
350
350
350
Red
Sunset orange
Yellow
Yellow-green
Yellow-green
Green
-30 to +85
-30 to +85
-40 to +100
-40 to +100
-30 to +85
-30 to +85
-40 to +100
-40 to +100
-30 to +85
-30 to +85
-40 to +100
-40 to +100
*1 The value is specified under the condition that either color is lightened separately. When the both diodes are lightened simultaneously,
the power dissipation of each diode should be less than the half of the value specified in this table.
*2 Duty ratio=1/10, Pulse width=0.1ms
*3 For 3s or less at the temperature of hand soldering. Temperature of reflow soldering is shown on the below page.
s
Absolute Maximum Ratings
*1
TYP
MAX
Model No.
Lens
type
Forward voltage
V
F
(V)
p
(nm)
TYP
I
V
(mcd)
TYP
I
F
(mA)
I
F
(mA)
I
F
(mA)
(MH
Z
)
V
R
(V)
I
R
(
Ķ
A)
MAX
C
t
(pF)
TYP
(nm)
TYP
Peak emission wavelength Luminous intensity Spectrum radiation bandwidth Reverse current Page for
characteristics
diagrams
Terminal capacitance
(T
a
=25įC)
Radiation
color
LT1EH67A
LT1KS67A
LT1ED67A
2.1
2.0
2.1
2.0
2.1
2.0
2.8
2.8
2.8
2.8
2.8
2.8
565
585
555
610
565
635
20
20
20
20
20
20
19.0
8.3
3.8
6.9
19.0
8.8
20
20
20
20
20
20
30
30
25
35
30
35
20
20
20
20
20
20
10
10
10
10
10
10
4
4
4
4
4
4
35
35
40
15
35
20
1
1
1
1
1
1
Milky
diffusion
Yellow-green
Yellow-green
Green
Sunset orange
Red
Yellow
s
Electro-optical Characteristics
(Unit : mm) (T
a
=25įC)
1616 Size, 0.8mm Thickness,
Compact Dichromatic Leadless
Chip LED Devices
120
(Notice)
°
In the absence of confirmation by device specification sheets, SHARP takes no responsibility for any defects that may occur in equipment using any SHARP
devices shown in catalogs, data books, etc. Contact SHARP in order to obtain the latest device specification sheets before using any SHARP device.
(Internet)
°
Data for sharp's optoelectronic/power device is provided for internet.(Address http://www.sharp.co.jp/ecg/)
LED Lamp
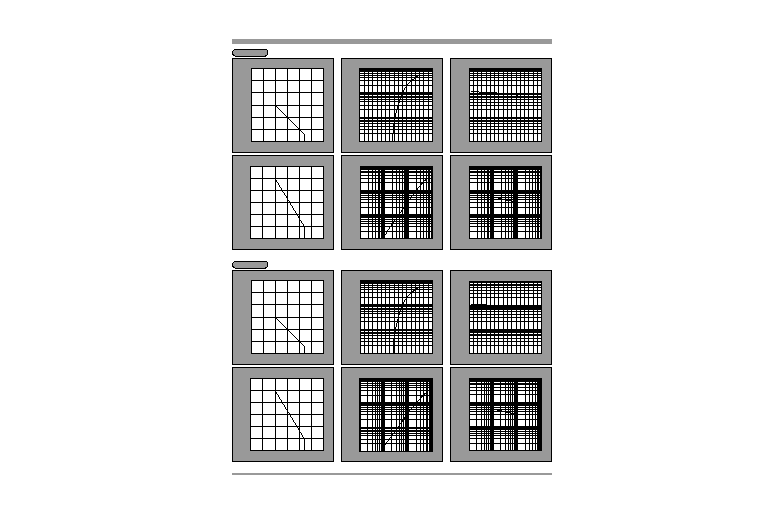
Characteristics Diagrams
EG series
0
10
20
30
40
50
60
-25
0
25
50
75 85
125
100
Peak Forward Current Derating Curve
Ambient temperature T
a
(
įC
)
P
e
a
k
f
o
r
w
a
r
d
c
u
r
r
e
n
t
I
F
M
(
m
A
)
0
10
20
30
40
50
60
-25
0
25
50
75 85
125
100
Forward Current Derating Curve
Ambient temperature T
a
(
įC
)
F
o
r
w
a
r
d
c
u
r
r
e
n
t
I
F
(
m
A
)
0.1
0.5
1.0
5.0
10
50
100
1.0
1.2
1.4
1.6
1.8
2.0
2.4
2.6
2.2
Forward Current vs. Forward Voltage(Note)
Forward voltage V
F
(V)
F
o
r
w
a
r
d
c
u
r
r
e
n
t
I
F
(
m
A
)
(T
a=
25įC)
1.0
5.0
10
50
100
500
1000
-20
0
20
40
60
80
120
100
Luminous Intensity vs. Ambient Temperature(Note)
Ambient temperature T
a
(
įC
)
R
e
l
a
t
i
v
e
l
u
m
i
n
o
u
s
i
n
t
e
n
s
i
t
y
(
%
)
(T
a=
25įC)
1.0
5.0
2.0
10
20
50
100
200
500
1000
0.1
0.2
0.5
1
2
5
10
20
50
Luminous Intensity vs. Forward Current(Note)
Forward current I
F
(mA)
R
e
l
a
t
i
v
e
l
u
m
i
n
o
u
s
i
n
t
e
n
s
i
t
y
(
%
)
(T
a=
25įC)
1.0
5.0
2.0
10
20
50
100
200
500
1/50
1/20 1/10
1/5
1/2
1
Duty Ratio vs. Peak Forward Current
Duty ratio D
R
P
e
a
k
f
o
r
w
a
r
d
c
u
r
r
e
n
t
I
F
M
(
m
A
)
(T
a=
25įC)
Note)Characteristics shown in diagrams are typical values. (not assurance value)
KG series
0
10
20
30
40
50
60
-25
0
25
50
75 85
125
100
Peak Forward Current Derating Curve
Ambient temperature T
a
(
įC
)
P
e
a
k
f
o
r
w
a
r
d
c
u
r
r
e
n
t
I
F
M
(
m
A
)
0
10
20
30
40
50
60
-25
0
25
50
75 85
125
100
Forward Current Derating Curve
Ambient temperature T
a
(
įC
)
F
o
r
w
a
r
d
c
u
r
r
e
n
t
I
F
(
m
A
)
0.1
0.5
1.0
5.0
10
50
100
1.0
1.2
1.4
1.6
1.8
2.0
2.4
2.6
2.2
Forward Current vs. Forward Voltage(Note)
Forward voltage V
F
(V)
F
o
r
w
a
r
d
c
u
r
r
e
n
t
I
F
(
m
A
)
(T
a=
25įC)
1.0
5.0
10
50
100
500
1000
-20
0
20
40
60
80
120
100
Luminous Intensity vs. Ambient Temperature(Note)
Ambient temperature T
a
(
įC
)
R
e
l
a
t
i
v
e
l
u
m
i
n
o
u
s
i
n
t
e
n
s
i
t
y
(
%
)
(T
a=
25įC)
1.0
5.0
2.0
10
20
50
100
200
500
1000
0.1
0.2
0.5
1
2
5
10
20
50
Luminous Intensity vs. Forward Current(Note)
Forward current I
F
(mA)
R
e
l
a
t
i
v
e
l
u
m
i
n
o
u
s
i
n
t
e
n
s
i
t
y
(
%
)
(T
a=
25įC)
1.0
5.0
2.0
10
20
50
100
200
500
1/50
1/20 1/10
1/5
1/2
1
Duty Ratio vs. Peak Forward Current
Duty ratio D
R
P
e
a
k
f
o
r
w
a
r
d
c
u
r
r
e
n
t
I
F
M
(
m
A
)
(T
a=
25įC)
LED Lamp
Characteristics Diagrams
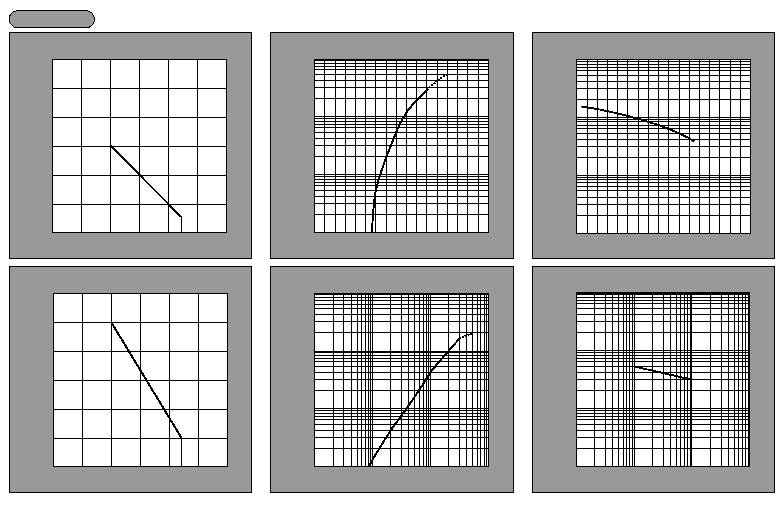
Note)Characteristics shown in diagrams are typical values. (not assurance value)
HS series
HY series
0.5
2
1
3
5
10
20
50
100
1.0
1.2
1.4
1.6
1.8
2.0
2.2
2.4
Forward Current vs. Forward Voltage(Note)
Forward voltage V
F
(V)
F
o
r
w
a
r
d
c
u
r
r
e
n
t
I
F
(
m
A
)
(T
a=
25įC)
10
20
50
200
100
500
1000
-20
0
20
40
60
100
80
Luminous Intensity vs. Ambient Temperature(Note)
Ambient temperature T
a
(
įC
)
R
e
l
a
t
i
v
e
l
u
m
i
n
o
u
s
i
n
t
e
n
s
i
t
y
(
%
)
(I
F=
20mA)
1
2
5
200
100
20
50
10
500
0.1
0.2
0.5
1
2
5
10
20
50
Luminous Intensity vs. Forward Current(Note)
Forward current I
F
(mA)
R
e
l
a
t
i
v
e
l
u
m
i
n
o
u
s
i
n
t
e
n
s
i
t
y
(
%
)
(T
a=
25įC)
5
10
30
50
100
300
500
1/50
1/20
1/10
1/5
1/2
1
Duty Ratio vs. Peak Forward Current
Duty ratio D
R
P
e
a
k
f
o
r
w
a
r
d
c
u
r
r
e
n
t
I
F
(
m
A
)
(T
a=
25įC)
0
10
20
30
40
50
60
-25
0
25
50
75 85
125
100
Peak Forward Current Derating Curve
Ambient temperature T
a
(
įC
)
P
e
a
k
f
o
r
w
a
r
d
c
u
r
r
e
n
t
I
F
M
(
m
A
)
0
10
20
30
40
50
60
-25
0
25
50
75 85
125
100
Peak Forward Current Derating Curve
Ambient temperature T
a
(
įC
)
P
e
a
k
f
o
r
w
a
r
d
c
u
r
r
e
n
t
I
F
M
(
m
A
)
0
10
20
30
40
50
60
-25
0
25
50
75 85
125
100
Forward Current Derating Curve
Ambient temperature T
a
(
įC
)
F
o
r
w
a
r
d
c
u
r
r
e
n
t
I
F
(
m
A
)
0
10
20
30
40
50
60
-25
0
25
50
75 85
125
100
Forward Current Derating Curve
Ambient temperature T
a
(
įC
)
F
o
r
w
a
r
d
c
u
r
r
e
n
t
I
F
(
m
A
)
0.1
0.5
1.0
5.0
10
50
100
1.0
1.2
1.4
1.6
1.8
2.0
2.4
2.6
2.2
Forward Current vs. Forward Voltage(Note)
Forward voltage V
F
(V)
F
o
r
w
a
r
d
c
u
r
r
e
n
t
I
F
(
m
A
)
(T
a=
25įC)
1.0
5.0
10
50
100
500
1000
-20
0
20
40
60
80
120
100
Luminous Intensity vs. Ambient Temperature(Note)
Ambient temperature T
a
(
įC
)
R
e
l
a
t
i
v
e
l
u
m
i
n
o
u
s
i
n
t
e
n
s
i
t
y
(
%
)
(T
a=
25įC)
1.0
5.0
2.0
10
20
50
100
200
500
1000
0.1
0.2
0.5
1
2
5
10
20
50
Luminous Intensity vs. Forward Current(Note)
Forward current I
F
(mA)
R
e
l
a
t
i
v
e
l
u
m
i
n
o
u
s
i
n
t
e
n
s
i
t
y
(
%
)
(T
a=
25įC)
1.0
5.0
2.0
10
20
50
100
200
500
1/50
1/20 1/10
1/5
1/2
1
Duty Ratio vs. Peak Forward Current
Duty ratio D
R
P
e
a
k
f
o
r
w
a
r
d
c
u
r
r
e
n
t
I
F
M
(
m
A
)
(T
a=
25įC)
119
(Notice)
°
In the absence of confirmation by device specification sheets, SHARP takes no responsibility for any defects that may occur in equipment using any SHARP
devices shown in catalogs, data books, etc. Contact SHARP in order to obtain the latest device specification sheets before using any SHARP device.
(Internet)
°
Data for sharp's optoelectronic/power device is provided for internet.(Address http://www.sharp.co.jp/ecg/)
118
(Notice)
°
In the absence of confirmation by device specification sheets, SHARP takes no responsibility for any defects that may occur in equipment using any SHARP
devices shown in catalogs, data books, etc. Contact SHARP in order to obtain the latest device specification sheets before using any SHARP device.
(Internet)
°
Data for sharp's optoelectronic/power device is provided for internet.(Address http://www.sharp.co.jp/ecg/)
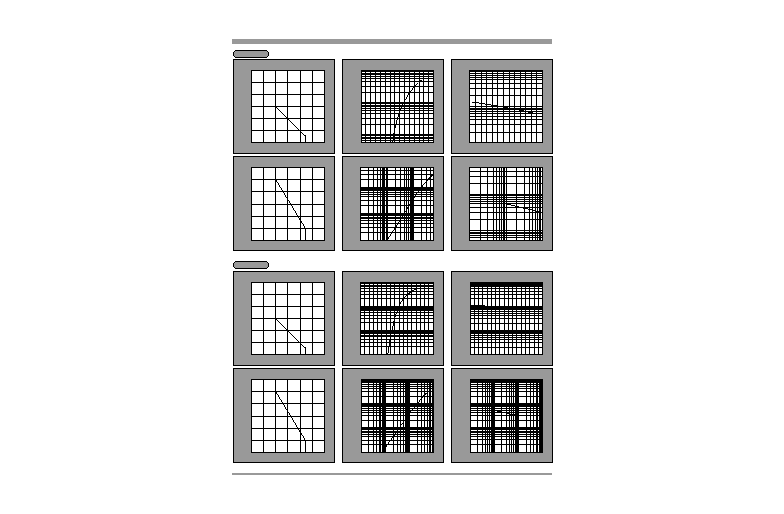
LED Lamp
Characteristics Diagrams
Note)Characteristics shown in diagrams are typical values. (not assurance value)
PR series
HD series
0
10
20
30
40
50
60
-25
0
25
50
75 85
125
100
Peak Forward Current Derating Curve
Ambient temperature T
a
(
įC
)
P
e
a
k
f
o
r
w
a
r
d
c
u
r
r
e
n
t
I
F
M
(
m
A
)
0
10
20
30
40
50
60
-25
0
25
50
75 85
125
100
Forward Current Derating Curve
Ambient temperature T
a
(
įC
)
F
o
r
w
a
r
d
c
u
r
r
e
n
t
I
F
(
m
A
)
0.1
0.5
1.0
5.0
10
50
100
1.0
1.2
1.4
1.6
1.8
2.0
2.4
2.6
2.2
Forward Current vs. Forward Voltage(Note)
Forward voltage V
F
(V)
F
o
r
w
a
r
d
c
u
r
r
e
n
t
I
F
(
m
A
)
(T
a=
25įC)
1.0
5.0
10
50
100
500
1000
-20
0
20
40
60
80
120
100
Luminous Intensity vs. Ambient Temperature(Note)
Ambient temperature T
a
(
įC
)
R
e
l
a
t
i
v
e
l
u
m
i
n
o
u
s
i
n
t
e
n
s
i
t
y
(
%
)
(T
a=
25
įC
)
1.0
5.0
2.0
10
20
50
100
200
500
1000
0.1
0.2
0.5
1
2
5
10
20
50
Luminous Intensity vs. Forward Current(Note)
Forward current I
F
(mA)
R
e
l
a
t
i
v
e
l
u
m
i
n
o
u
s
i
n
t
e
n
s
i
t
y
(
%
)
(T
a=
25įC)
1.0
5.0
2.0
10
20
50
100
200
500
1/50
1/20 1/10
1/5
1/2
1
Duty Ratio vs. Peak Forward Current
Duty ratio D
R
P
e
a
k
f
o
r
w
a
r
d
c
u
r
r
e
n
t
I
F
M
(
m
A
)
(T
a=
25įC)
0
10
20
30
40
50
60
-25
0
25
50
75 85
125
100
Peak Forward Current Derating Curve
Ambient temperature T
a
(
įC
)
P
e
a
k
f
o
r
w
a
r
d
c
u
r
r
e
n
t
I
F
M
(
m
A
)
0
10
20
30
40
50
60
-25
0
25
50
75 85
125
100
Forward Current Derating Curve
Ambient temperature T
a
(
įC
)
F
o
r
w
a
r
d
c
u
r
r
e
n
t
I
F
(
m
A
)
0.1
0.5
1.0
5.0
10
50
100
1.0
1.2
1.4
1.6
1.8
2.0
2.4
2.6
2.2
Forward Current vs. Forward Voltage(Note)
Forward voltage V
F
(V)
F
o
r
w
a
r
d
c
u
r
r
e
n
t
I
F
(
m
A
)
(T
a=
25įC)
1.0
5.0
10
50
100
500
1000
-20
0
20
40
60
80
120
100
Luminous Intensity vs. Ambient Temperature(Note)
Ambient temperature T
a
(
įC
)
R
e
l
a
t
i
v
e
l
u
m
i
n
o
u
s
i
n
t
e
n
s
i
t
y
(
%
)
(T
a=
25įC)
1.0
5.0
2.0
10
20
50
100
200
500
1000
0.1
0.2
0.5
1
2
5
10
20
50
Luminous Intensity vs. Forward Current(Note)
Forward current I
F
(mA)
R
e
l
a
t
i
v
e
l
u
m
i
n
o
u
s
i
n
t
e
n
s
i
t
y
(
%
)
(T
a=
25įC)
1.0
5.0
2.0
10
20
50
100
200
500
1/50
1/20 1/10
1/5
1/2
1
Duty Ratio vs. Peak Forward Current
Duty ratio D
R
P
e
a
k
f
o
r
w
a
r
d
c
u
r
r
e
n
t
I
F
M
(
m
A
)
(T
a=
25įC)
Note)Characteristics shown in diagrams are typical values. (not assurance value)