70
60
50
40
30
20
10
0
MPR, MVR, MAY, MPY
MAA, MPG, MBG
BR
5.5
±
0.2
(1)
o
/ 5
±
0.2
27.5MIN.
Meniscus 1MAX.
(2.
5)
29.5MIN.
0.7MAX.
0.5
±
0
.1
o
/ 5.6
±
0.2
n
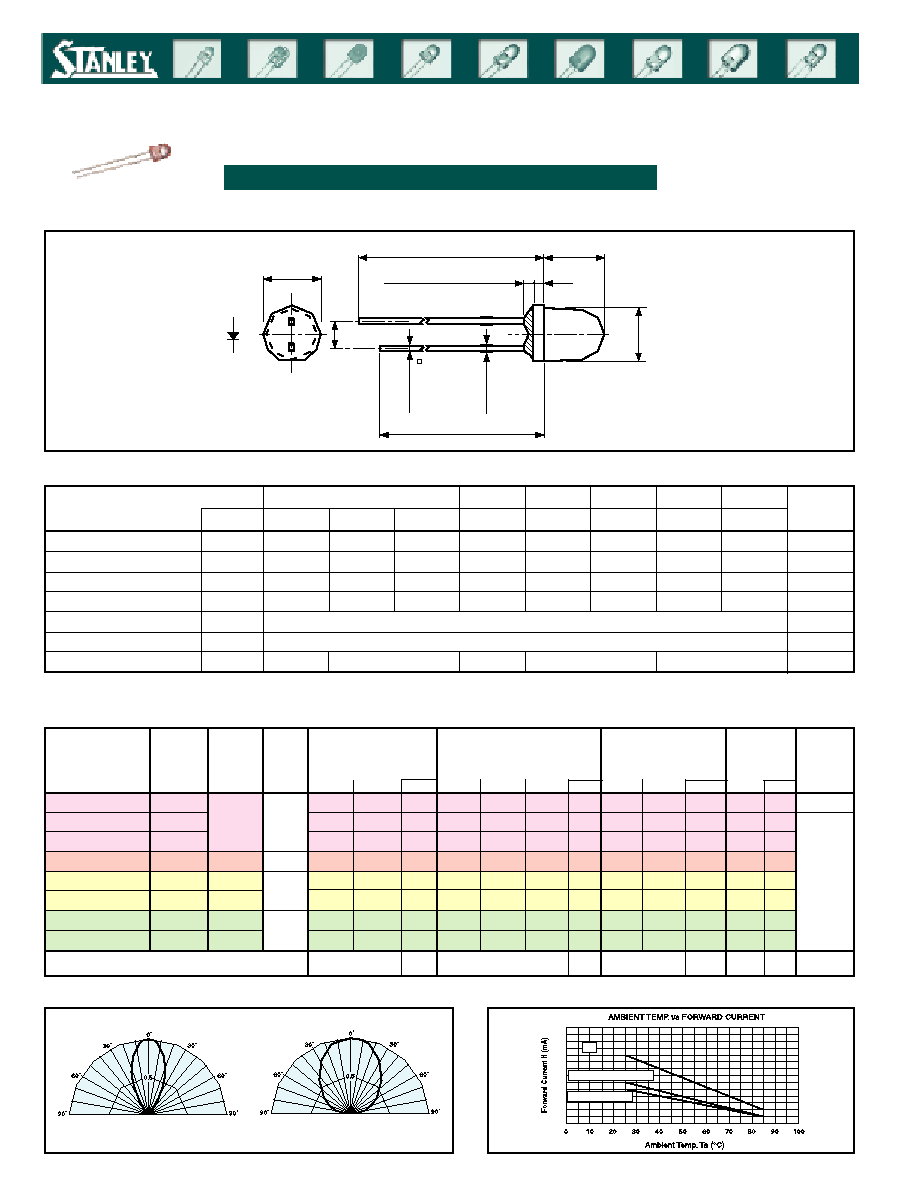
Operation Current Derating Chart
n
Spatial Distribution (x)
n
Outline Dimensions
5363X / 5373X Series
5363X / 5373X Series
S
T
A
N
D
A
R
D
C
O
L
O
R
SINGLE COLOR LED
n
Absolute Maximum Ratings
* Ta=25∞C, I
FM
applies for the pulse width
£
1msec. and duty cycle
£
1/20
The current derating for operation applies when the temperature is above 25∞C
(Ta=25∞C)
n
Electro-Optical Characteristics
(Ta=25∞C)
Part No.
TYP.
I
F
Wavelength
Spectral Line
Half Width
Forward
Voltage
V
F
TYP.
MAX.
I
F
Reverse
Current
IR
MAX.
V
R
Viewing
Angle**
(2
q
1/2
)
Red
Orange
Yellow
Yellow Green
Green
Pure Green
Pastel
Red
Pastel
Orange
Pastel
Yellow
Pastel
Green
30/12
4/2
20/10
20/10
20/10
30/12
20/10
10/3
15/6
2/1
10/5
10/5
10/5
15/6
10/5
5/1.5
20
10
20
20
20
20
20
20
660
700
630
605
580
570
560
555
647
635
624
606
590
572
567
558
30
100
30
30
30
30
30
30
20
10
20
20
20
20
20
20
1.7
2.1
2.0
2.2
2.2
2.1
2.1
2.1
2.0
2.8
2.8
2.8
2.8
2.8
2.8
2.8
20
10
20
20
20
20
20
20
100
20
20
20
20
20
20
20
4
4
4
4
4
4
4
4
GaAlAs
GaP
GaAsP
GaAsP
GaAsP
GaP
GaP
GaP
BR5363X/5373X
MPR5363X/5373X
MVR5363X/5373X
MAA5363X/5373X
MAY5363X/5373X
MPY5363X/5373X
MPG5363X/5373X
MBG5363X/5373X
Units
5363X
5373X
mcd
mA
nm
mA
mA
µA
V
Deg.
V
MIN.
Dl
TYP.
Peak
l
p
TYP.
I
F
Luminous
Intensity
IV
Lens
Color*
Emitted
Color
60/110∞
50/100∞
Material
Dominant
l
d
TYP.
mW
mA
mA
V
∞C
∞C
mA/∞C
0.67
0.40
Orange
Yellow
Yellow Green
Green
Pure Green
Red
0.33
0.40
0.33
Units
Item
-30 to +85
-30 to +100
Power Dissipation
Forward Current
Peak Forward Current
Reverse Voltage
Operating Temperature
Storage Temperature
Derating (DC)*
Symbol
Pd
I
F
I
FM
V
R
Topr
Tstg
D
I
F
BR
100
50
300
4
MPR
75
30
75
4
MVR
75
30
75
4
MAA
70
25
60
4
MAY
85
30
75
4
MPY
85
30
75
4
MPG
70
25
60
4
MBG
70
25
60
4
Unit: mm
f
5mm Round Shape
*5363X lens is clear and 5373X lens is diffused
**The viewing angle is an average and will vary by color
*Spatial distribution is viewed as a typical illustration and will vary by color