March 2006
Rev 1
1/8
8
STTH312
Ultrafast recovery - 1200 V diode
Main product characteristics
Features and benefits
Ultrafast, soft recovery
Very low conduction and switching losses
High frequency and/or high pulsed current
operation
High reverse voltage capability
High junction temperature
Description
The high quality design of this diode has
produced a device with low leakage current,
regularly reproducible characteristics and intrinsic
ruggedness. These characteristics make it ideal
for heavy duty applications that demand long term
reliability.
Such demanding applications include industrial
power supplies, motor control, and similar
mission-critical systems that require rectification
and freewheeling. These diodes also fit into
auxiliary functions such as snubber, bootstrap,
and demagnetization applications.
The improved performance in low leakage
current, and therefore thermal runaway guard
band, is an immediate competitive advantage for
this device.
Order codes
I
F(AV)
3 A
V
RRM
1200 V
T
j
175∞ C
V
F
(typ)
1.15 V
t
rr
(typ)
55 ns
Part Number
Marking
STTH312B
STTH312B
STTH312B-TR
STTH312B
K
A
DPAK
STTH312B
K
A
NC
www.st.com

Characteristics
STTH312
2/8
1 Characteristics
To evaluate the conduction losses use the following equation: P =
1.4
x I
F(AV)
+
0.1
I
F
2
(RMS)
Table 1.
Absolute ratings (limiting values at 25∞ C, unless otherwise specified)
Symbol
Parameter
Value
Unit
V
RRM
Repetitive peak reverse voltage
1200
V
I
F(RMS)
RMS forward current
6
A
I
F(AV)
Average forward current,
= 0.5
T
c
= 150∞ C
3
A
I
FRM
Repetitive peak forward current
t
p
= 5 µs, F = 5 kHz square
35
A
I
FSM
Surge non repetitive forward current
t
p
= 10 ms Sinusoidal
35
A
T
stg
Storage temperature range
-65 to + 175
∞C
T
j
Maximum operating junction temperature
175
∞C
Table 2.
Thermal parameter
Symbol
Parameter
Value
Unit
R
th(j-c)
Junction to case
3.8
∞C/W
Table 3.
Static electrical characteristics
Symbol
Parameter
Test conditions
Min.
Typ
Max.
Unit
I
R
(1)
Reverse leakage current
T
j
= 25∞ C
V
R
= V
RRM
10
µA
T
j
= 125∞ C
2
100
V
F
(2)
Forward voltage drop
T
j
= 25∞ C
I
F
= 3 A
2
V
T
j
= 125∞ C
1.20
1.7
T
j
= 150∞ C
1.15
1.65
1.
Pulse test: t
p
= 5 ms,
< 2 %
2.
Pulse test: t
p
= 380 µs,
< 2 %
STTH312
Characteristics
3/8
Table 4.
Dynamic characteristics
Symbol
Parameter
Test conditions
Min.
Typ
Max.
Unit
t
rr
Reverse recovery time
I
F
= 1 A, dI
F
/dt = -50 A/µs,
V
R
= 30 V, T
j
= 25∞ C
115
ns
I
F
= 1 A, dI
F
/dt = -100 A/µs,
V
R
= 30 V, T
j
= 25∞ C
55
80
I
RM
Reverse recovery current
I
F
= 3 A, dI
F
/dt = -200 A/µs,
V
R
= 600 V, T
j
= 125∞ C
9.5
14
A
S
Softness factor
I
F
= 3 A, dI
F
/dt = -200 A/µs,
V
R
= 600 V, T
j
= 125∞ C
2
t
fr
Forward recovery time
I
F
= 3 A dI
F
/dt = 50 A/µs
V
FR
= 1.5 x V
Fmax
, T
j
= 25∞ C
350
ns
V
FP
Forward recovery voltage
I
F
= 3 A, dI
F
/dt = 50 A/µs,
T
j
= 25∞ C
12
V
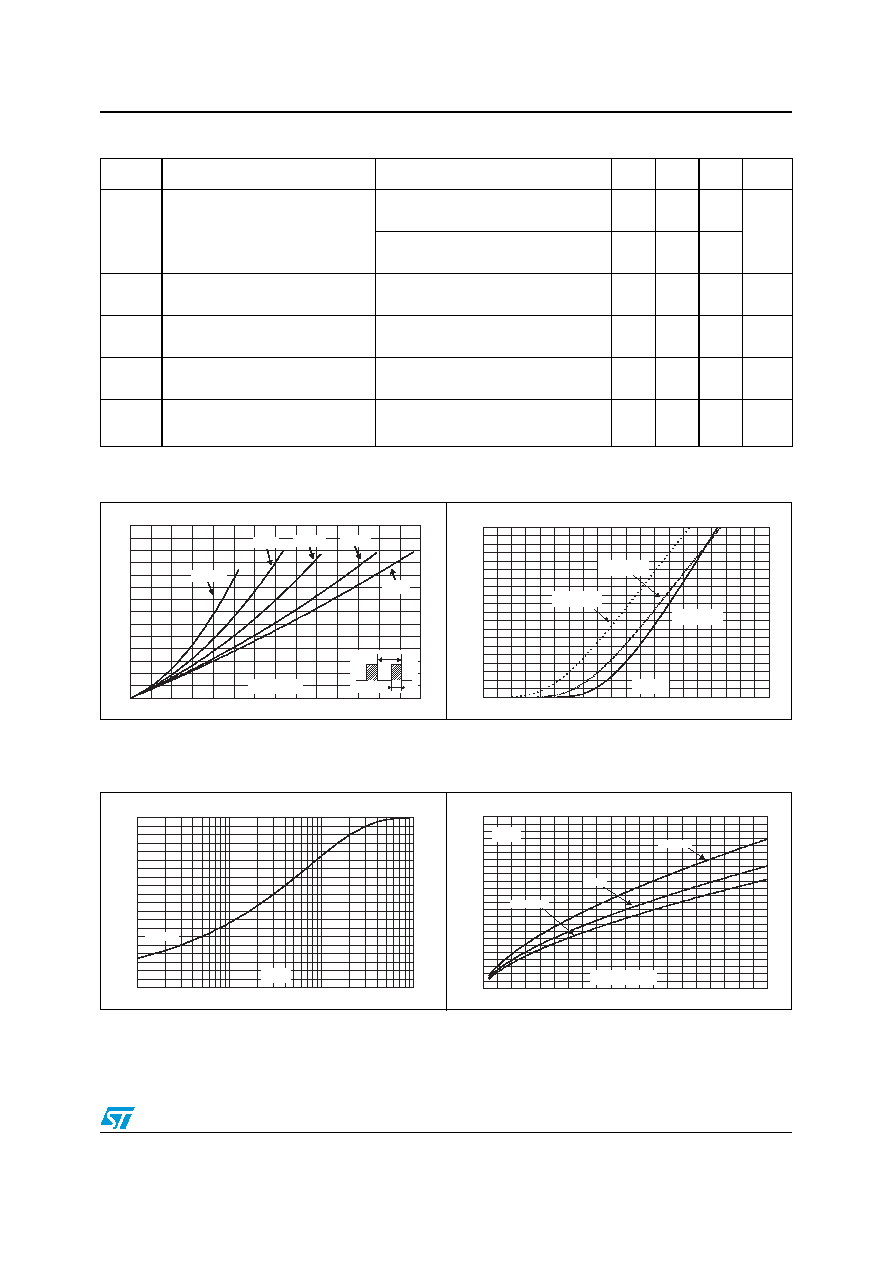
Figure 1.
Conduction losses versus
average current
Figure 2.
Forward voltage drop versus
forward current
0
1
2
3
4
5
6
7
0.0
0.5
1.0
1.5
2.0
2.5
3.0
3.5
P(W)
T
=tp/T
tp
= 0.05
= 1
I
(A)
F(AV)
= 0.1
= 0.2
= 0.5
0
5
10
15
20
25
30
35
40
45
50
0.0
0.5
1.0
1.5
2.0
2.5
3.0
3.5
4.0
4.5
5.0
I
(A)
FM
V
(V)
FM
T =25∞C
(maximum values)
j
T =150∞C
(maximum values)
j
T =150∞C
(typical values)
j
Figure 3.
Relative variation of thermal
impedance junction to case
versus pulse duration
Figure 4.
Peak reverse recovery current
versus dI
F
/dt (typical values)
0.0
0.1
0.2
0.3
0.4
0.5
0.6
0.7
0.8
0.9
1.0
1.E-03
1.E-02
1.E-01
1.E+00
Z
/R
th(j-c)
th(j-c)
t (s)
p
Single pulse
0
2
4
6
8
10
12
14
16
18
20
22
24
0
50
100
150
200
250
300
350
400
450
500
I
(A)
RM
dI /dt(A/µs)
F
I =2 x I
F
F(AV)
I =I
F
F(AV)
I =0.5 x I
F
F(AV)
V =600V
T =125∞C
R
j
Characteristics
STTH312
4/8
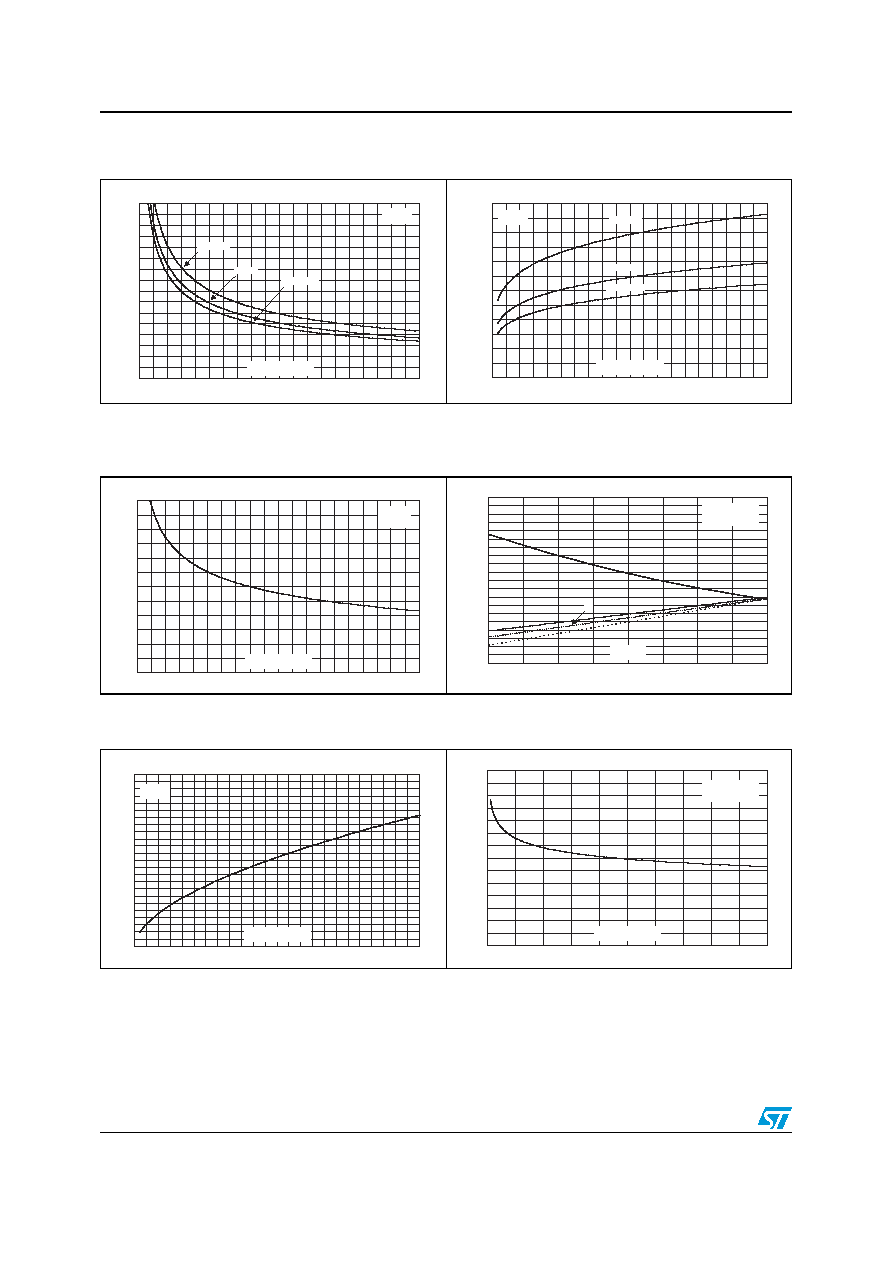
Figure 5.
Reverse recovery time versus
dI
F
/dt (typical values)
Figure 6.
Reverse recovery charges versus
dI
F
/dt (typical values)
0
50
100
150
200
250
300
350
400
0
50
100
150
200
250
300
350
400
450
500
t (ns)
rr
dI /dt(A/µs)
F
I =2 x I
F
F(AV)
I =I
F
F(AV)
I =0.5 x I
F
F(AV)
V =600V
T =125∞C
R
j
0
200
400
600
800
1000
1200
0
50
100
150
200
250
300
350
400
450
500
Q (nC)
rr
dI /dt(A/µs)
F
V =600V
T =125∞C
R
j
I =2 x I
F
F(AV)
I =I
F
F(AV)
I =0.5 x I
F
F(AV)
Figure 7.
Softness factor versus
dI
F
/dt (typical values)
Figure 8.
Relative variations of dynamic
parameters versus junction
temperature
0.5
1.0
1.5
2.0
2.5
3.0
3.5
0
50
100
150
200
250
300
350
400
450
500
S factor
dI /dt(A/µs)
F
I
2xI
T =125∞C
F
F(AV)
j
V =600V
R
0.00
0.25
0.50
0.75
1.00
1.25
1.50
1.75
2.00
2.25
2.50
25
50
75
100
125
I
RM
Q
RR
S factor
T (∞C)
j
I =I
Reference: T =125∞C
F
F(AV)
j
V =600V
R
t
rr
Figure 9.
Transient peak forward voltage
versus dI
F
/dt (typical values)
Figure 10.
Forward recovery time versus dI
F
/dt
(typical values)
0
5
10
15
20
25
30
35
40
45
50
55
60
0
25
50
75
100
125
150
175
200
225
250
275
300
V
(V)
FP
dI /dt(A/µs)
F
I =I
T =125∞C
F
F(AV)
j
0
100
200
300
400
500
600
700
0
100
200
300
400
500
t (ns)
fr
dI /dt(A/µs)
F
I =I
T =125∞C
F
F(AV)
j
V
=1.5 x V max.
FR
F
STTH312
Characteristics
5/8
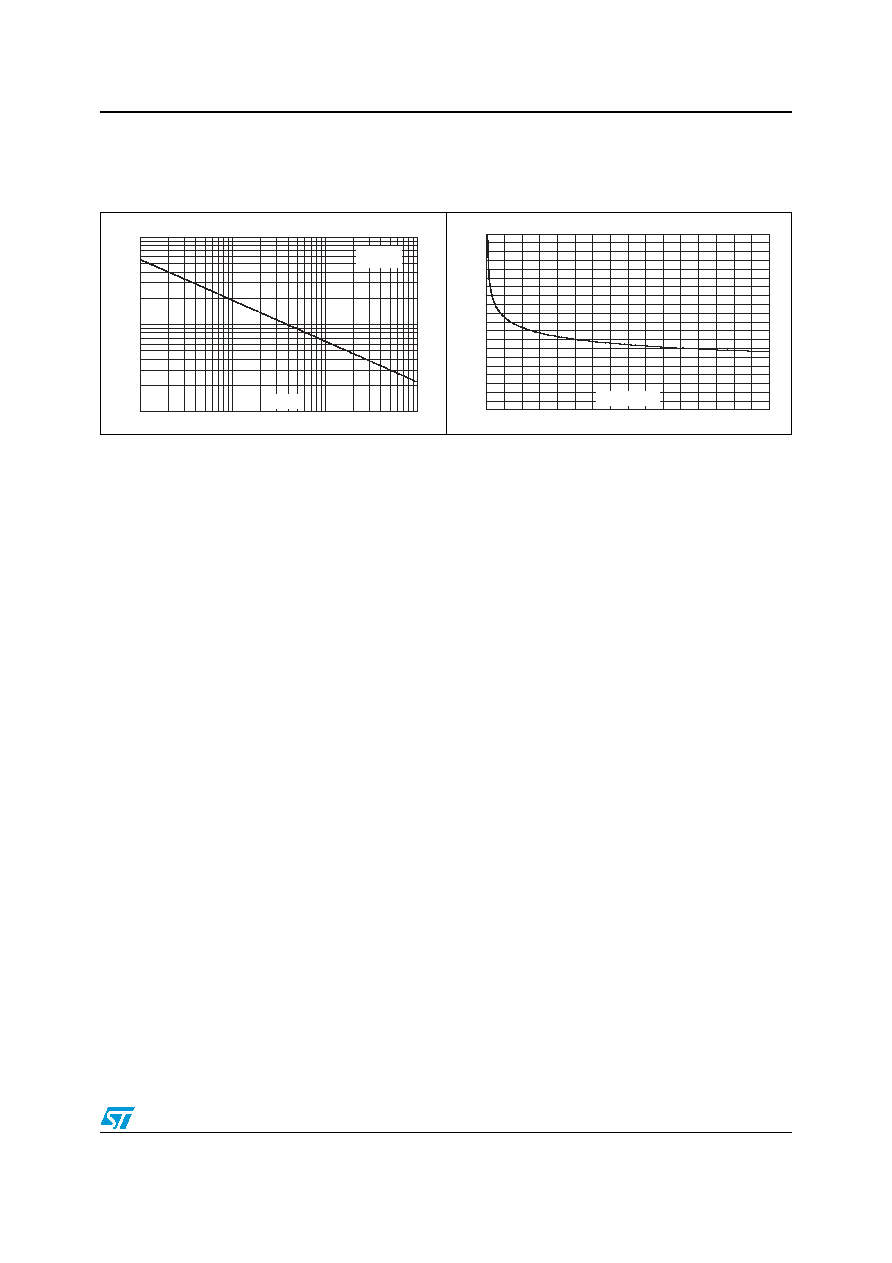
Figure 11.
Junction capacitance versus
reverse voltage applied (typical
values)
Figure 12.
Thermal resistance junction to
ambient versus copper surface
under tab (printed circuit board
FR4, e
cu
= 35 µm)
1
10
100
1
10
100
1000
C(pF)
V (V)
R
F=1MHz
V
=30mV
T =25∞C
OSC
RMS
j
0
10
20
30
40
50
60
70
80
90
100
0
5
10
15
20
25
30
35
40
S
(cm≤)
CU
R
(∞C/W)
th(j-a)