TSKS5412X01
Rev. A6, 15-Oct-98
1 (7)
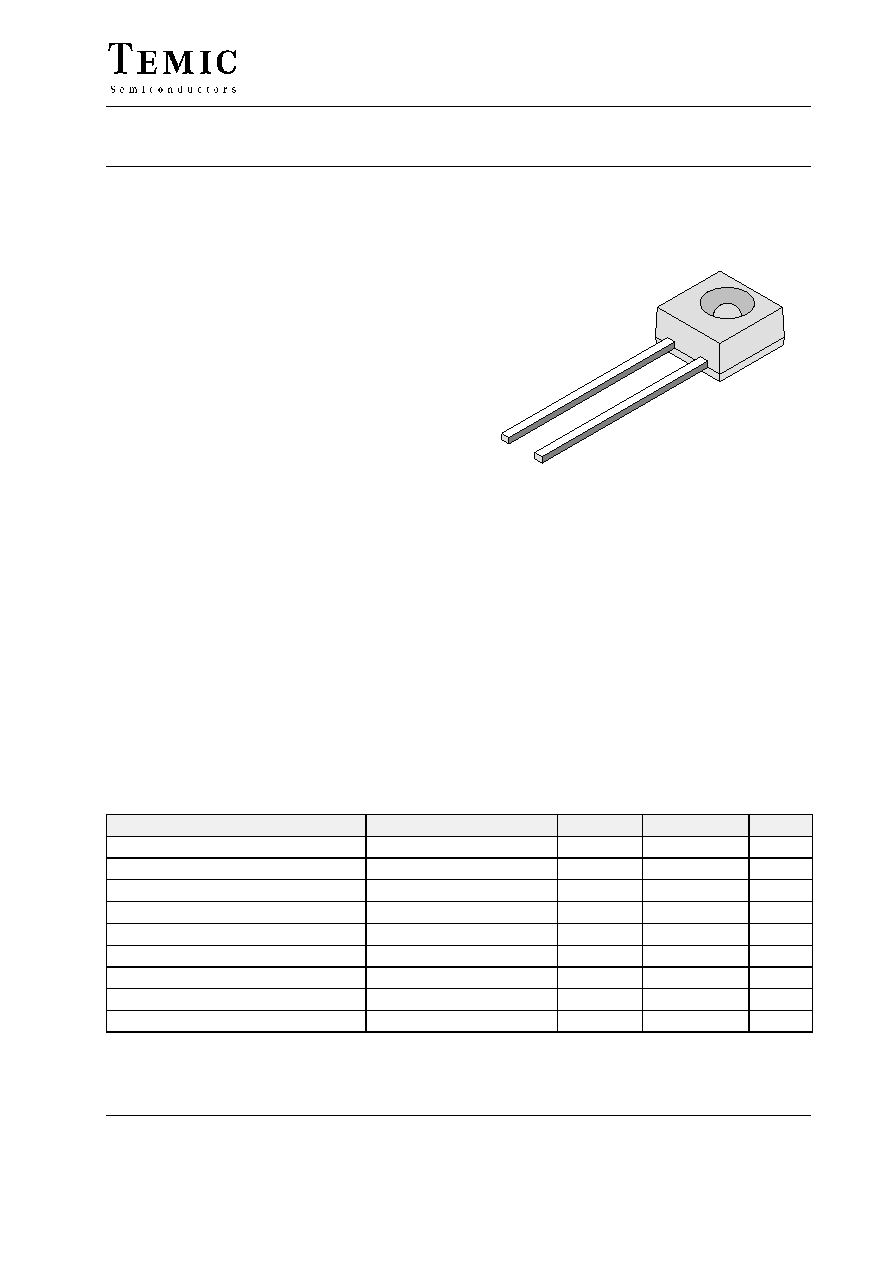
GaAs Infrared Emitting Diode in Side View Package
Description
TSKS5412 is a standard GaAs infrared emitting diode in
a flat sideview molded plastic package. A small recessed
spherical lens provides an improved radiant intensity in
a low profile case. The diode is case compatible to the
TEKS5412 photodetector, allowing the user to assemble
his own optical sensor.
Features
D Side view case with spherical lens
D Radiation direction perpendicular to
mounting direction
D Angle of half intensity
=
±
30
∞
D Peak wavelength l
p
= 950 nm
D Case compatible with TEKS5412
D Option X01: High rel. device for advanced
applications
D Fan-fold packing according to IEC 286 part 2
D Packing AMMOPACK: 2,000 pcs
D Ordering code number: TSKS5412X01ASZ
D Visual inspection according to QSV 5610
14 354
Absolute Maximum Ratings
T
amb
= 25
_C
Parameter
Test Conditions
Symbol
Value
Unit
Reverse Voltage
V
R
6
V
Forward Current
I
F
100
mA
Surge Forward Current
t
p
x100 ms
I
FSM
2
A
Power Dissipation
P
V
170
mW
Junction Temperature
T
j
100
∞C
Operating Temperature Range
T
stg
≠40...+85
∞C
Storage Temperature Range
T
stg
≠40...+100
∞C
Soldering Temperature
t
x 5 s, 2 mm from body
T
sd
260
∞C
Thermal Resistance Junction/Ambient
R
thJA
450
K/W
TSKS5412X01
Rev. A6, 15-Oct-98
2 (7)
Basic Characteristics
T
amb
= 25
_C
Parameter
Test Conditions
Symbol
Min
Typ
Max
Unit
Forward Voltage
I
F
= 100 mA, t
p
x 20 ms
V
F
1.3
1.7
V
Reverse Voltage
I
R
= 10
mA
V
VR
6
V
Junction Capacitance
V
R
= 0 V, f = 1 MHz, E = 0
C
j
50
pF
Radiant Intensity
I
F
= 50 mA, t
p
x 20 ms
I
e
2.3
7
mW/sr
Radiant Power
I
F
= 50 mA, t
p
x 20 ms
f
e
5
mW
Temp. Coefficient of
f
e
I
F
= 50 mA
TK
fe
≠1
%/K
Angle of Half Intensity
±
30
deg
Peak Wavelength
I
F
= 50 mA
l
p
950
nm
Spectral Bandwidth
I
F
= 50 mA
Dl
50
nm
Rise time
I
F
=1A, t
p
/T=0.01, t
p
x10ms
t
r
400
ns
Fall Time
I
F
=1A, t
p
/T=0.01, t
p
x10ms
t
f
450
ns
Additional Test
D 100% inspection of body with infrared camera.
test criteria: no cracks allowed
TSKS5412X01 / TEKS5412X01 matched (for Reference only)
Parameters
Test Conditions
Symbol
Min.
Typ.
Max.
Unit
Input threshold current
V
S1
= 5 V
I
FT
1.5
mA
Hysteresis
V
S1
= 5 V
I
Foff
/I
Fon
80
%
Output voltage
I
OL
= 16 mA, I
F
> I
FT
V
S1
= 5 V
0.2
0.4
V
Switching frequency
I
F
= 3 x I
FT
, R
L
= 1 k
W
V
S1
= V
S2
= 5 V
f
sw
200
KHz
Remark: Parameter tested with test fixture provided by Kostal (LENKWINKELSENSOR)
TSKS5412X01
Rev. A6, 15-Oct-98
3 (7)
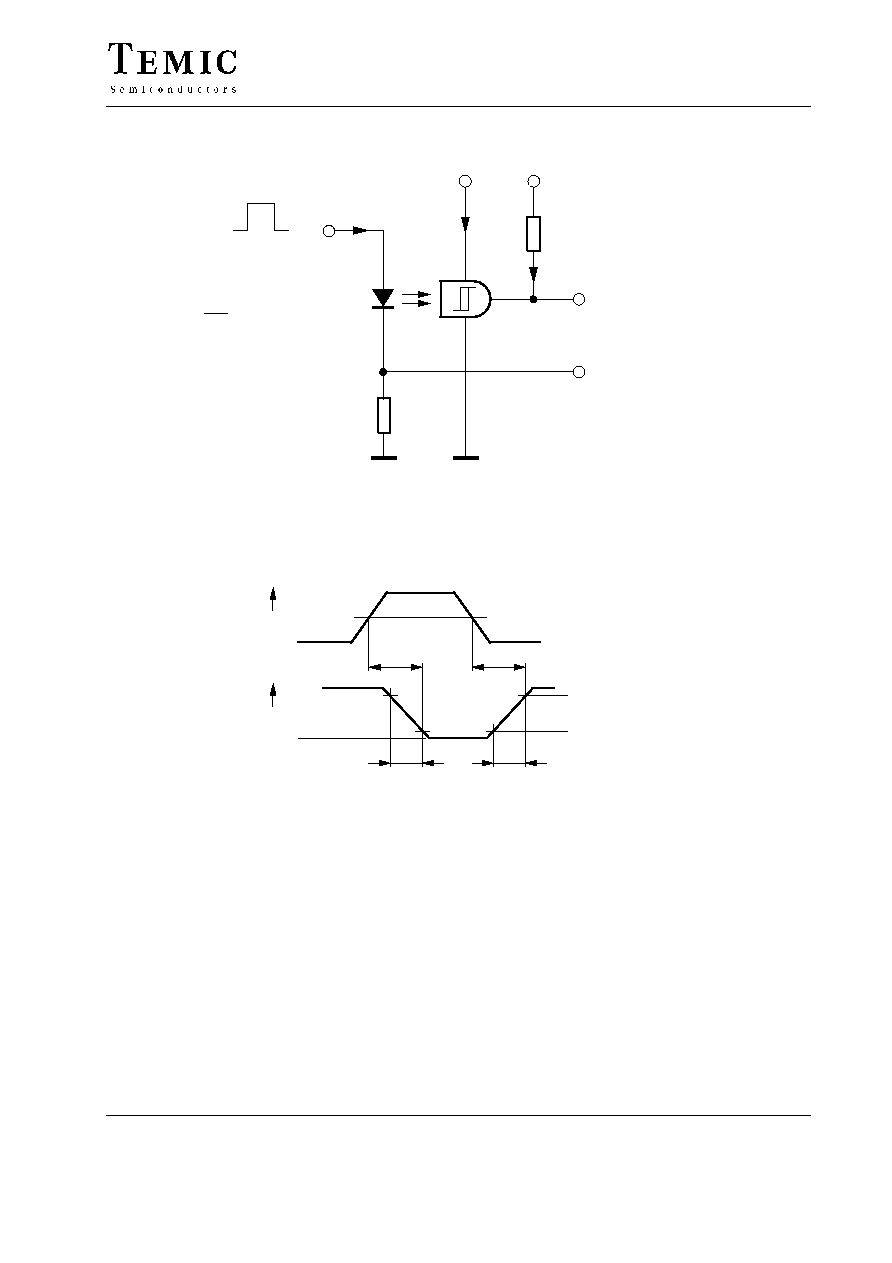
Channel I
Channel II
50
W
Oscilloscope
R
L
w 1 MW
C
L
v 20 pF
I
F
R
G
= 50
W
t
p
t
p
= 10
ms
T
= 0.01
0
96 12153
R
L
= 1 k
W
I
O
V
S1
= 5 V
V
S2
= 5 V
I
S1
V
O
IR≠Diode
Figure 1. Test circuit
50%
o
t
on
t
off
Channel II
o
t
f
t
r
90%
10%
I
F
V
O
95 10819
Channel I
Figure 2. Pulse diagram
TSKS5412X01
Rev. A6, 15-Oct-98
4 (7)
Typical Characteristics (T
amb
= 25
_C unless otherwise specified)
0
50
100
150
200
0
20
40
60
80
100
T
amb
≠ Ambient Temperature (
∞
C )
14846
P
≠ Power Dissipation ( mW
)
V
R
thJA
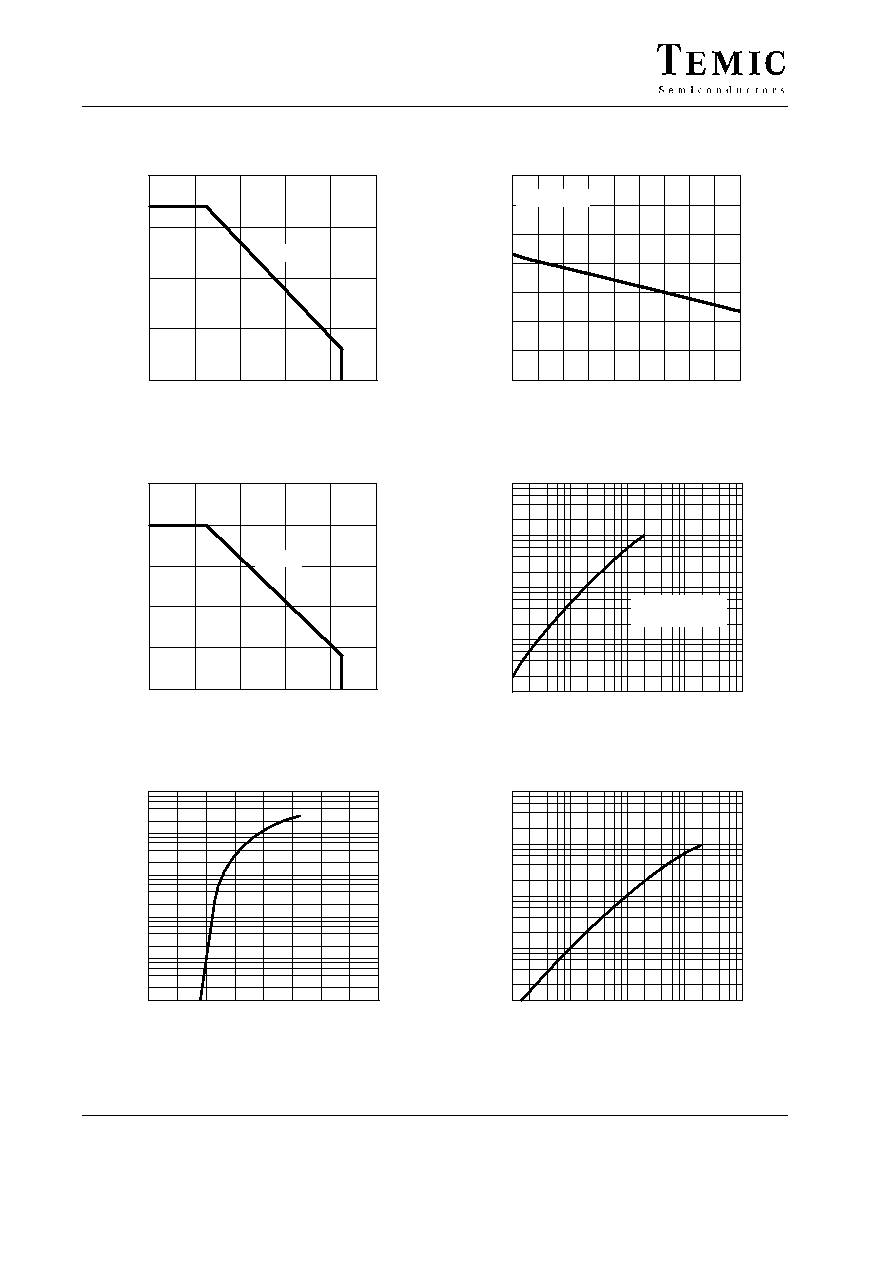
Figure 3. Power Dissipation vs. Ambient Temperature
0
25
50
75
100
125
0
20
40
60
80
100
T
amb
≠ Ambient Temperature (
∞
C )
14847
R
thJA
I ≠ Forward Current ( mA
)
F
Figure 4. Forward Current vs. Ambient Temperature
0
1
2
3
V
F
≠ Forward Voltage ( V )
4
94 7996 e
10
1
10
0
10
2
10
3
10
4
10
≠1
I ≠ Forward Current ( mA
)
F
Figure 5. Forward Current vs. Forward Voltage
0.8
0.9
1.0
1.1
1.2
1.3
1.4
1.5
≠45 ≠30 ≠15
0
15
30
45
60
75
90
T
amb
≠ Ambient Temperature (
∞
C )
14347
I
F
= 10 mA
V
≠ Relative Forward
V
oltage
Frel
Figure 6.
Relative Forward Voltage vs. Ambient Temperature
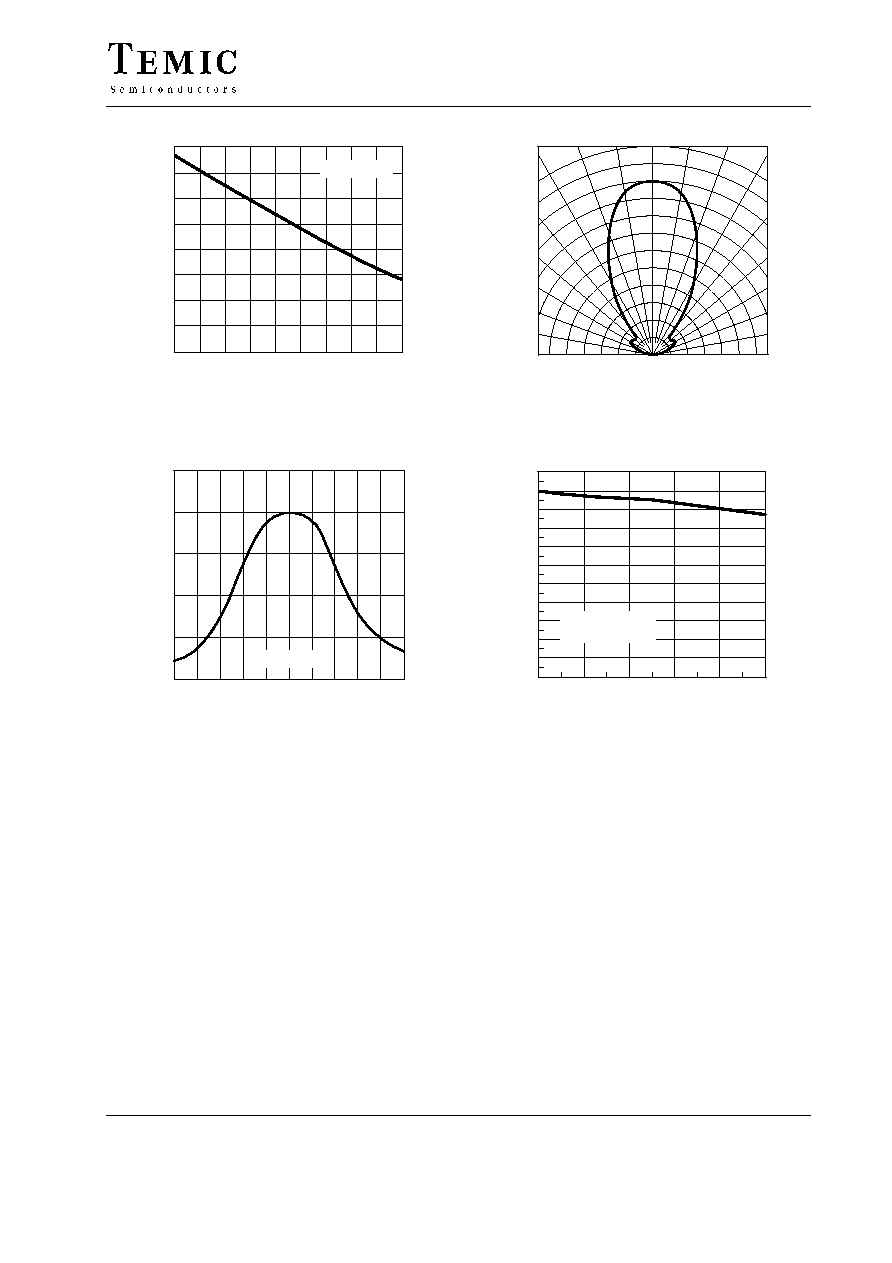
94 7913 e
10
3
10
1
10
2
10
4
10
0
0.01
0.1
1
100
10
I
F
≠ Forward Current ( mA )
I ≠ Radiant Intensity ( mW/sr )
e
tp / T = 0.001
tp = 100
ms
Figure 7. Radiant Intensity vs. Forward Current
I
F
≠ Forward Current ( mA )
94 7914 e
10
3
10
1
10
2
10
4
10
0
0.1
1
10
1000
100
≠ Radiant Power ( mW
)
e
F
Figure 8.
Radiant Power vs. Forward Current
TSKS5412X01
Rev. A6, 15-Oct-98
5 (7)
0
0.2
0.4
0.6
0.8
1.0
1.2
1.4
1.6
≠45 ≠30 ≠15
0
15
30
45
60
75
90
T
amb
≠ Ambient Temperature (
∞
C )
14348
I ;
e rel e rel
F
I
F
= 10 mA
Figure 9. Rel. Radiant Intensity\Power vs.
Ambient Temperature
900
950
0
0.25
0.5
0.75
1.0
1.25
l ≠ Wavelength ( nm )
1000
94 7994 e
≠ Relative Radiant Power
e rel
F
I
F
= 100 mA
Figure 10.
Relative Radiant Power vs. Wavelength
0.4
0.2
0
0.2
0.4
I ≠ Relative Radiant Intensity
e rel
0.6
14349
0.6
0.9
0.8
0
∞
30
∞
10
∞
20
∞
40
∞
50
∞
60
∞
70
∞
80
∞
0.7
1.0
Figure 11. Relative Radiant Intensity vs.
Angular Displacement
0
10
20
30
40
50
60
70
80
90
100
110
0
400
800
1200
1600
2000
I in % of initial value
Test duration
14884
e
I
F
= 10 mA DC,
T
amb
= 85
∞
C
Figure 12 Typical degradation of I
e
vs. Test duration