
AlGaAs/GaAs HIGH POWER SIDE LOOK PACKAGE
INFRARED EMITTING DIODE
MIE-144A1
Description
The MIE-144A1 is a GaAs infrared emitting diode
with AlGaAs Window layer, molded in clear, lensed
side looking package. The MIE-144A1 provides a
broad range of intensity selection .
Features
l
Selected to specific on-line intensity and
radiant intensity ranges
l
Low cost, plastic side looking package
Absolute Maximum Ratings
@ T
A
=25
o
C
Parameter
Maximum Rating
Unit
Power Dissipation
75
mW
Peak Forward Current
1
A
Continuos Forward Current
50
mA
Reverse Voltage
5
V
Operating Temperature Range
Storage Temperature Range
Lead Soldering Temperature
02/04/2002
-55
o
C
to +100
o
C
-55
o
C
to +100
o
C
260
o
C
for 5 seconds
Unity Opto Technology Co., Ltd.
Notes :
1. All dimensions are in millimeters.(inches).
2. Protruded resin under flange is 1.5 mm (0.059") max.
3. Lead spacing is measured where the leads emerge from the package.
Unit: mm( inches )
1.31±0.12
(.052±.005)
2.54 ±0.12
(.100±.005)
(SEE NOTE 3)
5.70±0.30
(.224±.012)
0.48±0.05
(.019±.002)
4.00±0.07
(.156±.003)
1.22
(.048)
1.80
(.070)
0.80±0.07
(.032±.003)
60
1.50±0.12
(.089±.005)
1.10±0.07
(.043±.003)
0.75±0.08
(.030±.003)
1.50
(.059)
0.65 max
C
A
2.90±0.12
(.114±.005)
4.12
(.162)
1.0min
MIE-144A1
Optical-Electrical Characteristics
@ T
A
=25
o
C
Parameter
Test Conditions
Symbol
Min.
Typ .
Max.
Unit
Radiant Incidance
I
F
=20mA
Ee
-
0.6
-
mW/cm
2
Forward Voltage
I
F
=20mA
V
F
-
1.2
1.35
V
Reverse Current
V
R
=5V
I
R
-
-
100
µ
A
Peak Wavelength
I
F
=20mA
p
-
940
-
nm
Spectral Bandwidth
I
F
=20mA
-
50
-
nm
Half View Angle
I
F
=20mA
2
1/2
-
80
-
deg .
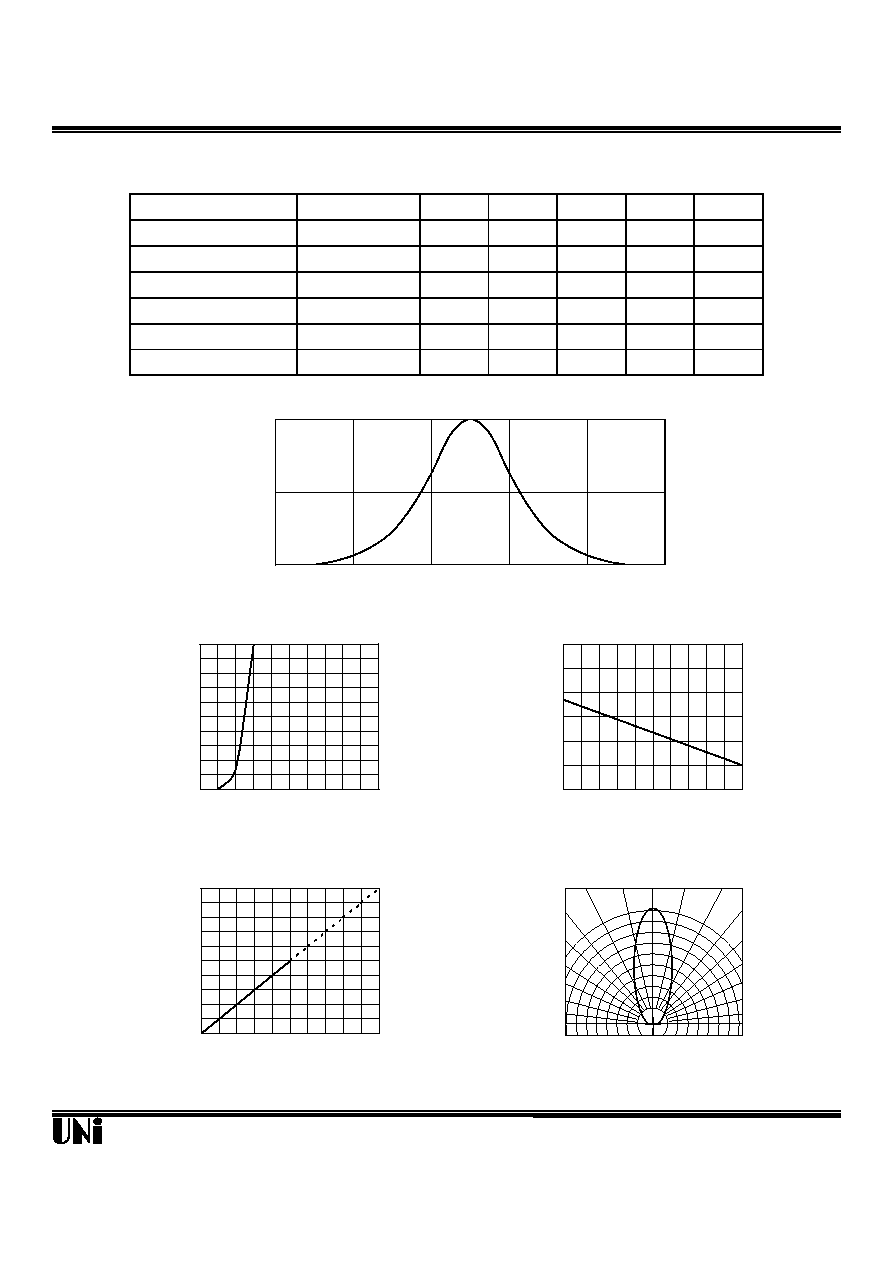
Typical Optical-Electrical Characteristic Curves
02/04/2002
Unity Opto Technology Co., Ltd.
0
20
40
60
80
100
0.0
1.2
1.6
2.0
2.4
2.8
0.0
0.5
1.0
1.5
2.0
2.5
3.0
-40
-20
0
20
40
60
Ambient Temperature T
A
(
o
C)
FIG.3 RELATIVE RADIANT INTENSITY
VS. AMBIENT TEMPERATURE
Output Power To Value
I
F
=20mA
0
1
2
3
4
5
0
20
40
60
80
100
Forward Current (mA)
FIG.4 RELATIVE RADIANT INTENSITY
VS. FORWARD CURRENT
Output Power Relative To
Value at I
F
=20mA
0
0.5
1
840
880
920
960
1000
1040
Wavelength (nm)
FIG.1 SPECTRAL DISTRIBUTION
Relative Radiant Intensity
Forward Voltage (V)
FIG.2 FORWARD CURRENT VS.
FORWARD VOLTAGE
Forward Current (mA)
Relative Radiant Intensity
0∞ 10∞ 20∞
0.5 0.3 0.1 0.2 0.4 0.6
1.0
0.9
0.8
30∞
40∞
50∞
60∞
70∞
80∞
90∞
FIG.5 RADIATION DIAGRAM