 | –≠–ª–µ–∫—Ç—Ä–æ–Ω–Ω—ã–π –∫–æ–º–ø–æ–Ω–µ–Ω—Ç: QPO-1L | –°–∫–∞—á–∞—Ç—å:  PDF PDF  ZIP ZIP |

Set your site on PICOR at www.picorpower.com
PRELIMINARY
Vicor Corp. Tel: 800-735-6200, 978-470-2900 Fax: 978-475-6715
QPO-1 Data Sheet
Page 1 of 8
Parameter
Rating
Unit
Notes
+In to ≠In
33
Vdc
Continuous
+In to ≠In
40
Vdc
100ms
Load current
15
A
Continuous
Maximum power dissipation
4
W
Operating temperature
-20 to +85
∞C
Ambient
Package thermal resistance
50
∞C/W
Free Air
Package thermal resistance
TBD
∞C/W
Optimum heat sinking
Storage temperature
-40 to +125
∞C
Features
∑ >20dB PARD attenuation from
50Hz to 500kHz
∑ Supports point of load regulation
∑ Peak ripple detector optimizes
performance automatically
∑ Significantly improves load
transient response
∑ Efficiency up to 98%
∑ User selectable performance
optimization
∑ 3-30Vdc operating range
∑ 10A rating
Product Highlights
Picor's QPO-1 output ripple attenuator
System-in-a-Package (SiP) provides active
filtering to achieve greater than 20 dB
attenuation of periodic and random deviation
(PARD) over the frequency range of
50Hz to 500kHz.
The QPO-1 operates over a voltage range
of 3 to 30Vdc and is compatible with most
switching power supplies and converters.
The load is regulated by using remote
sensing or a reference type trim adjustment
feature as is commonly found on most
power supplies.
The QPO-1's closed loop architecture
greatly improves load transient response
while ensuring steady-state precise point of
load voltage regulation. The QPO-1 is
available in surface mountable Land Grid
and Ball Grid Array terminations.
Data Sheet
QuietPower
TM
Output Ripple Attenuation SiP
Shown actual size:
1.0 x 1.0 x 0.2 in
25 x 25 x 5 mm
Absolute Maximum Ratings
Exceeding these parameters may result in permanent damage to the product
Part Numbering
Patents Pending
Q P O - 1 L
L = Land Grid Array
B = Ball Grid Array

Vicor Corp. Tel: 800-735-6200, 978-470-2900 Fax: 978-475-6715
QPO-1 Data Sheet
Page 2 of 8
Set your site on VICOR at www.vicorpower.com
PRELIMINARY
QPO-1 SiP SPECIFICATIONS (-20∞C to +100∞C PCB Substrate temperature)
Electrical Characteristics
Electrical characteristics apply over the full operating range of input voltage, output power and PCB substrate temperature, unless
otherwise specified. All temperatures refer to the operating temperature at the interface of the PCB surface with proper reflow mounting of
QPO-1. The PCB surface must have sufficient area and heat via's to the opposite side to achieve the optimum thermal resistance.
QPO-1 Output
R
HR
Value (ohms)
3.0V
20k
5.0V
33.3k
12.0V
80k
15.0V
100k
24.0V
160k
28.0V
187k
Table 1--R
HR
computed values for V
HR
= 375mV @100mA.
Parameter
Min
Max
Unit
Notes
Operating current range
0.03
10
A
There is no internal current limiting. The system must
be properly fused such that the current does not exceed
the absolute maximum rating of 15A. A minimum
current of 30mA is needed to maintain regulation.
Operating input voltage
3.0
30
Vdc
Continuous
Transient output response
Step load change rates <1A/µs
@ 2A step
50
mVp-p
V
HR
=375mV @ 100mA, Input capacitance = 200µF
@ 10A step
50
mVp-p
V
HR
=375mV @ 100mA, Input capacitance = 1500µF
V
HR
headroom voltage range
(1)
225
525
mV
@ 100mA load with 100mVp-p ripple.
See Table 1 for headroom setting R
HR
resistor values.
QPO
OUT
+V
HR
must be set below converter over voltage trip.
Output noise
10
mVp-p
Input PARD = 100mVp-p, 50Hz-500kHz
5
mVrms
SC output current accuracy
(2)
±1
%
See Note 2 and Figure 2 for setting R
SS
value
I
SC
=V
HR
/ R
SS
QPO-1 bias current
60
mA
Power dissipation
4.0
W
QPO
OUT
= 28V; Iout = 10A
V
HR
= 375mV @ 100mA
(without slope adjust or peak detection.)
(1)
Headroom voltage, peak detection and slope adjustment must be chosen by the user based on attenuation and efficiency requirements.
The functional description section explains how to optimize the configuration of the QPO-1 for the voltage source used. The headroom
voltage is the difference between the input and the output of the QPO-1 and is set by the selection of resistor R
HR
.
Calculate R
HR
as shown.
R
HR
= (QPO
OUT
/ V
HR
) x 2.5k (see Table 1 for example values)
(2)
R
SS
resistor sets the correction current required to trim the source output up to accommodate the headroom of the QPO-1 when remote
sense is not used. This function will accommodate power supplies with positive reference based trim configuration.
R
SS
= R
IN *
V
OUT
/ V
RPT
( If a converter is trimmed down use the resulting V
OUT
voltage in the formula for R
SS
)
Where:
R
IN
= input resistance of the SC or Trim pin;
V
OUT
= source output voltage;
V
RPT
= SC or Trim pin pre-trimmed reference
Set your site on PICOR at www.picorpower.com
PRELIMINARY
Vicor Corp. Tel: 800-735-6200, 978-470-2900 Fax: 978-475-6715
QPO-1 Data Sheet
Page 3 of 8
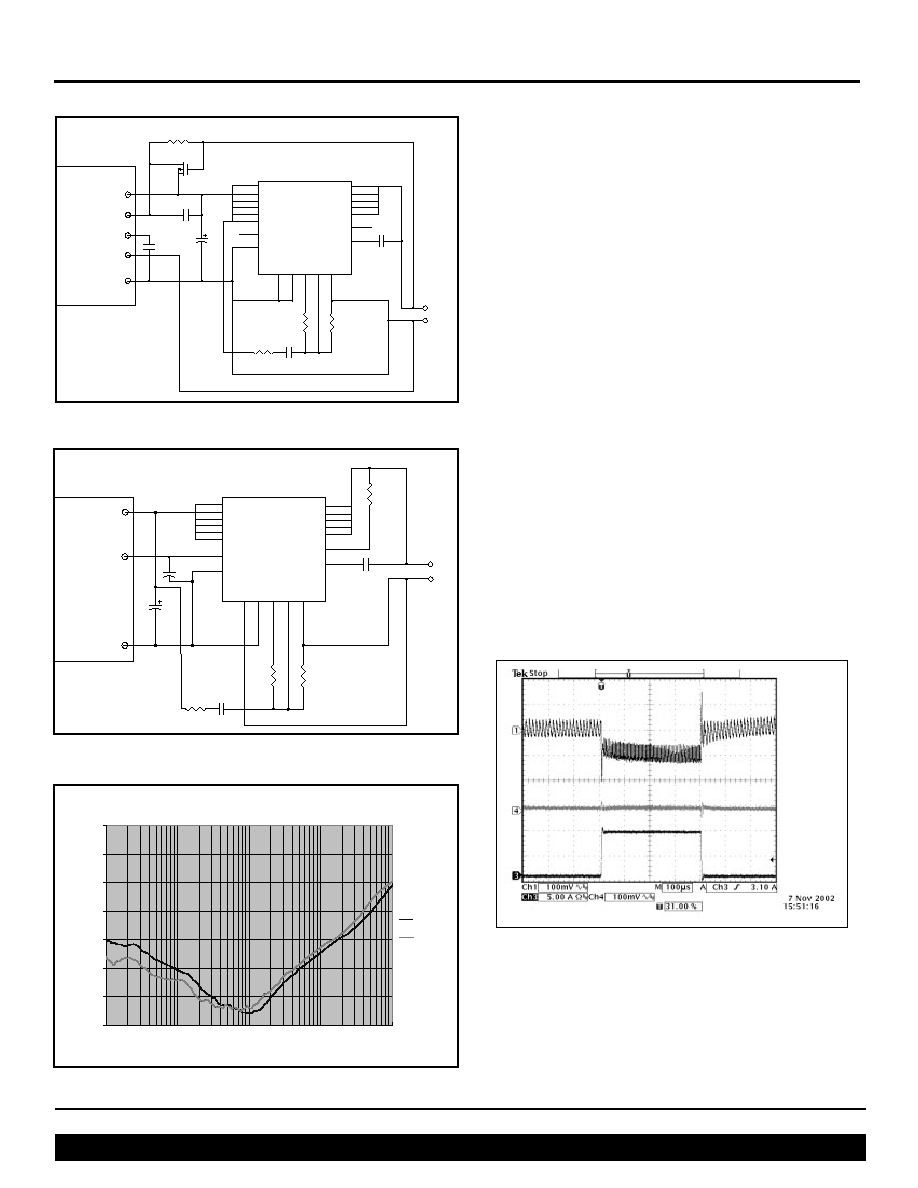
Application Notes
Figure 1--Typical Configuration using Remote Sensing
Figure 2--Typical Configuration using Trim Control
R
HR
C
co
15uF
QPO
OUT
9
SLOPE ADJ
2
7
SC SET 6
CESR 5
8
10
17
VREF
3
GND
1
SC
16
PEAK
IN
15
14
18
13
QPO
IN
12
11
REFGND
4
GND
19
GND
20
QPO-1
R
SA
Load
Cps*
Rps
+
≠
{
{
10
IN*
20k** 4.7uF**
1W
Module
+ OUT
+ Sense
≠ Sense
Module
≠ OUT
Trim
C
SC
*
*Optional Component
See Description
**Required only for
engineering samples
Qp*
R
HR
R
SS
C
co
15uF
SLOPE ADJ
2
SC SET 6
CESR
5
VREF
3
GND
1
SC
16
REFGND
4
GND
19
GND
20
QPO-1
R
SA
Load
+
≠
IN*
C
SC
*
Module
+ OUT
Trim
Module
≠ OUT
QPO
OUT
9
7
8
10
17
PEAK
IN
15
14
18
13
QPO
IN
12
11
{
{
*Optional Component
See Description
20k** 4.7uF**
**Required only for
engineering samples
Functional Description
The QPO-1 is an active power filter that provides attenuation
of power supply output PARD. The measured attenuation
performance over frequency is shown in Figure 3 at output
voltage conditions of 3.3 and 28 Vdc. The user can select
and optimize the attenuation versus power dissipation by
setting the headroom voltage of the active loop.
The conditions in Figure 3 were measured with a low current
headroom setting of 375mV with approximately 100mV
peak-to-peak ripple voltage on the input to the QPO-1. The
remote sense circuit configuration was used as shown in
Figure 1 with the peak detector function enabled. Some
power supplies need to sense the output ripple for proper
operation. Cps couples the unfiltered ripple back to the sense
input while Rps provides the DC feedback to the power
supply from the load.
Typical improvement in output noise and transient
performance with a 3.3V converter is shown in Figure 4.
This measured data demonstrates the reduction in noise and
ripple at the output of the QPO-1 versus the source output as
well as the transient capability stepping from 1 to 10A
load current - the maximum current rating. This particular
converter has sufficient output capacitance and response
time to load changes such that no additional capacitance,C
IN,
is needed on the input of the QPO-1 to reach a 10A level and
still maintain the output within ±50mV.
Ch1: QPO
IN
Ch4: QPO
OUT
Ch3: Load Current ≠ 10A peak, pulse width = 400µS
Load Current Static = 1A
Load Current Transient = 9A
Headroom Voltage @ 100mA = 400mV
Attenuation VS Frequency
-70
-60
-50
-40
-30
-20
-10
0
1.00E+02
1.00E+03
1.00E+04
1.00E+05
1.00E+06
Frequency (Hz)
Attenuation (dB)
28V 10A
3.3V 10A
Figure 3-- Attenuation vs. Frequency
Figure 4 ≠ Transient Response using a Vicor
3.3V Half Brick Converter
Vicor Corp. Tel: 800-735-6200, 978-470-2900 Fax: 978-475-6715
QPO-1 Data Sheet
Page 4 of 8
Set your site on VICOR at www.vicorpower.com
PRELIMINARY
The product can be used with voltage sources from 3 to 30Vdc
by using either the remote sense or the voltage trim feature.
The two different circuit schematics are shown in Figures 1 and
2. For either configuration, the source output will increase to
accommodate the headroom setting of the QPO-1 filter to
maintain the load voltage at the required level.
The user can optimize performance by setting the low current
(100mA) headroom operating point per Table 1 or by using the
formulas in Notes 1 and 2 above the table. The user must be
aware of the sources over-voltage set-point and not create a
headroom voltage that will cause a shutdown condition. For this
reason it is recommended that the QPO-1 be used with power
supplies running at their factory preset voltages or in a trimmed
down configuration.
In low voltage applications (<12V), it may be required to use the
C
SC
capacitor. This creates a soft starting of the source
preventing the output from tripping the over voltage function
while the QPO-1 output line comes up to the set-point. The C
SC
value will be converter dependent but is typically around 5 to
22µF. Remote sensing may also require Qp for start up, use a
logic level low voltage PFET such as IRLML6401 or equivalent.
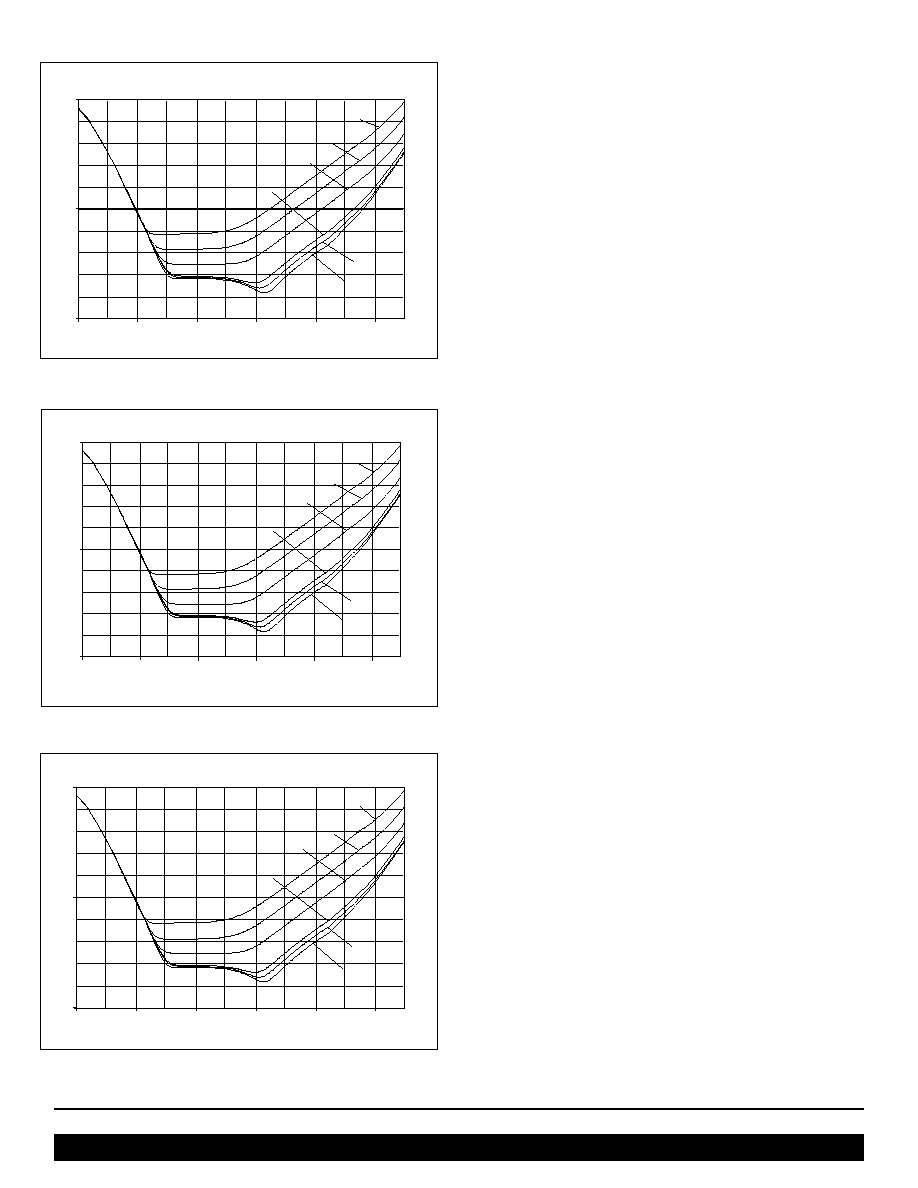
The spice simulation Figures 5, 6, and 7 demonstrate the effects
of headroom versus attenuation for 3.3, 15, and 28V respectively.
The attenuation and power dissipation will decrease with
headroom setting so a trade-off can be selected for efficiency
versus attenuation. The transient performance is proportional to
the headroom setting, power source response time and the
capacitance present at the input to the QPO-1. The capacitance
may be within the power supply that is used or supplemented by
external capacitance. Consideration of the source's sensitivity to
additional output capacitance and stability must be understood
before additional capacitance is added for enhancement of
transient performance.
The QPO-1 has two additional features that the user can select to
further optimize performance. The first is a headroom slope
adjustment that reduces the headroom voltage drop with
increasing load current. The second is a peak detector function
that increases the headroom voltage by the peak of the ripple
voltage.
Headroom Slope Adjustment
This can be used to allow for more headroom and improved
transient response at lower loads and also to approximate
constant power dissipation over the load range. The slope of this
curve is set by the slope adjust resistor R
SA
. See below for setting
the R
SA
value. The headroom in Figures 5, 6, and 7 are at 10A
and have been reduced by 150mV from the low current
headroom setting with the slope function using an R
SA
value of
8.2k
. This feature is useful to improve efficiency when used
with converters that have decreasing ripple with increasing load
current such as is typical with Vicor products.
1 0 H z
1 0 0 H z
1 . 0kHz
1 0 k H z
1 0 0 k H z
1 .
1.
0 M H z
- 1 0 0
- 5 0
0
dB
VHR=203mV
VHR=167mV
VHR=134mV
VHR=103mV
VHR=256mV
VHR=300mV
Vout = 3.3V, ILOAD = 10A
F r e q u e n c y
Vout = 15V, ILOAD = 10A
1 0 H z
- 1 0 0
- 5 0
0
dB
1.0kHz
1 0 k H z
1 0 0 k H z
1 . 0 M H z
F r e q u e n c y
100Hz
VHR=203mV
VHR=167mV
VHR=134mV
VHR=103mV
VHR=256mV
VHR=300mV
Figure 5 ≠ Attenuation vs Frequency @ 3.3 volts
Figure 6 ≠ Attenuation vs frequency @ 15 volts
F r e q u e n c y
1 0 H z
1 0 0 H z
1 . 0 k H z
1 0 k H z
1 0 0 k H z
1 . 0 M H z
VHR=203mV
VHR=167mV
VHR=134mV
VHR=103mV
VHR=256mV
VHR=300mV
VOUT = 28V, ILOAD = 10A
- 1 0 0
- 5 0
0
dB
Figure 7 ≠ Attenuation vs Frequency @ 28 volts
Set your site on PICOR at www.picorpower.com
PRELIMINARY
Vicor Corp. Tel: 800-735-6200, 978-470-2900 Fax: 978-475-6715
QPO-1 Data Sheet
Page 5 of 8
The slope adjust feature can be set to zero providing relative
constant headroom versus load using an R
SA
of 100k
. The user
can optimize performance based on the expected variation in load
current and the desired power dissipation range. The formula
below should be used to calculate the R
SA
value for the desired
headroom versus current slope. If the peak detector is enabled,
the peak of the ripple will be added back to the headroom at a
given load condition.
R
SA
= ((
I*0.05)/
V) *2500
Example: For a 5A maximum load and a 150mV
reduction in headroom.
R
SA
=((5A*0.05/0.15V)*2500
= 4.167k
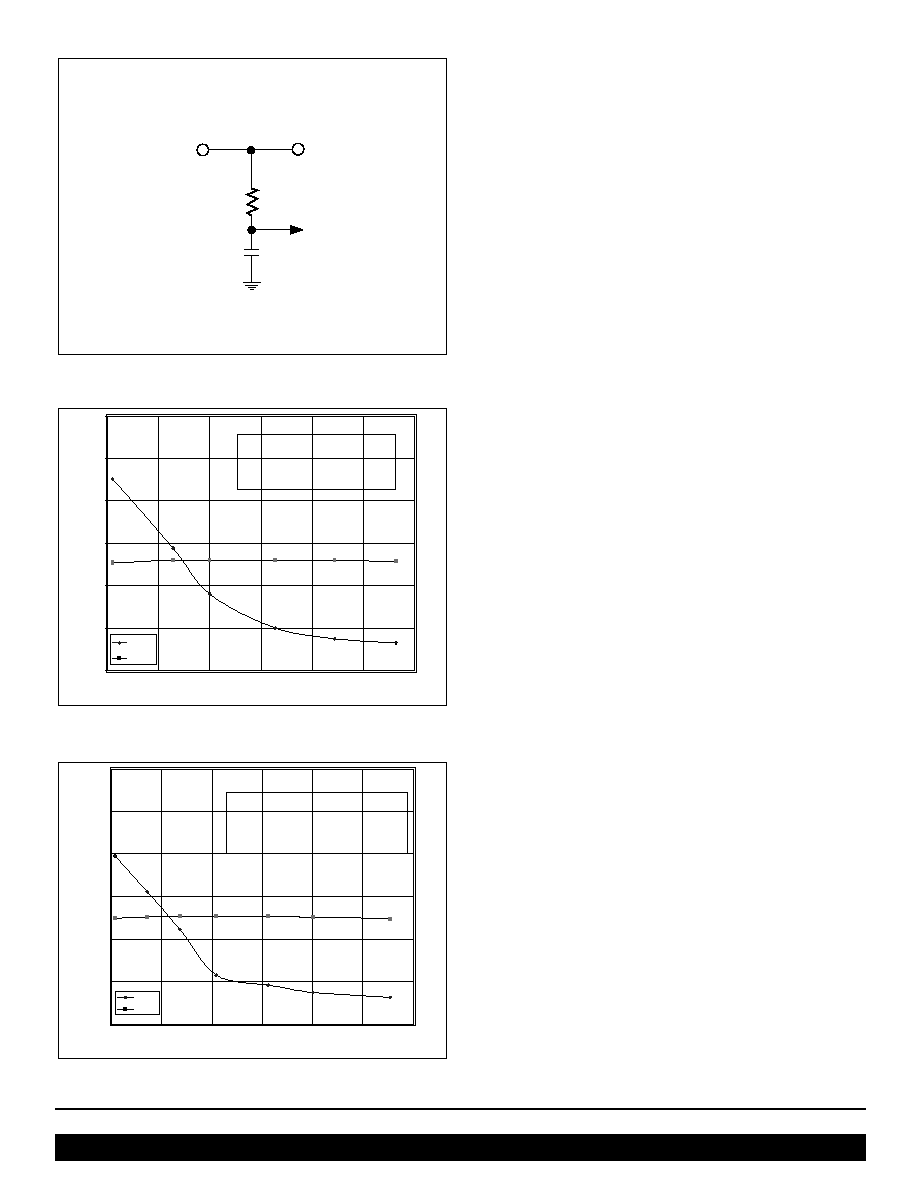
Peak Detector Function
This feature dynamically adds to the headroom voltage to
accommodate converter ripple variation. This feature can be
enabled by connecting the PEAK
IN
pin to the QPO
IN
pin and
disabled by putting a small RC filter at the PEAK
IN
pin as shown
in Figure 8.
The active loop performance has been optimized for 45 degrees
of phase margin over the expected load range. C
CO
shown in Figs
1 and 2 must be a low ESR ceramic capacitor. Loading the
QPO-1 directly with low ESR ceramic capacitance will affect the
phase margin and is not recommended. The distributed load
capacitance and inductance of the load path will vary depending
on the application. The effects of a distributed load impedance
on phase margin when very low ESR load capacitance is present
will typically be mitigated by the distributed inductance of the
load path. The transient load response in Figure 4 was measured
with approximately 10nH of distributed inductance between
QPO-1 output and the load board which had a 15µF low ESR
ceramic capacitor across the static load resistance.
The following is a summary of the optional configurations that a
user can select for the QPO-1.
∑ No slope adjust, no peak detect:
fixed headroom over ripple amplitude and current.
∑ Same as above, but with peak detect enabled:
peak of ripple amplitude is added to the headroom voltage
optimizing headroom with varying ripple amplitude.
∑ No peak detection with slope adjust:
to improve transient load range and efficiency trading off
attenuation at high current.
∑ Using both peak detection and slope adjust:
to accommodate ripple amplitude variation with increased
transient capability and efficiency.
Module
+ OUT
QPO
IN
PEAK
IN
1k
0.1
µ
F
Figure 8 ≠ Peak detector Disable Circuit
QPO-1 Attenuation vs. Power
Iload=10A
1% Rhr std. values for VOUT=3.3V 15V 28V
Rss=100k (delta Vhr = 0mV from 0.1 to 10A)
3.3V 15V 28V
69.8k 324k 602k
47.5k 215k 402k
39.2k 178k 332k
30.1k 137k 255k
24.9k 113k 210k
21k 95.3k 178k
-60
-50
-40
-30
-20
-10
0
1
2
3
4
Watts
dB
500kHz
50Hz
Figure 9 ≠ Power vs Attenuation without slope
QPO-1 Attenuation vs. Power
Iload=10A
1% Rhr std. values for VOUT=3.3V 15V 28V
Rss=7.1k (delta Vhr =150mV from 0.1 to 10A)
14.3k 64.9k 121k
16.5k 75k 140k
18.2k 82.5k 154k
21k 95.3k 178k
22.6k 102k 191k
24.9k 113k 210k
3.3V 15V 28V
27.4k 124k 232k
-60
-50
-40
-30
-20
-10
0
1
2
3
4
Watt
dB
500kHz
50Hz
Figure 10 ≠ Power vs Attenuation with slope adjust
Vicor Corp. Tel: 800-735-6200, 978-470-2900 Fax: 978-475-6715
QPO-1 Data Sheet
Page 6 of 8
Set your site on VICOR at www.vicorpower.com
PRELIMINARY
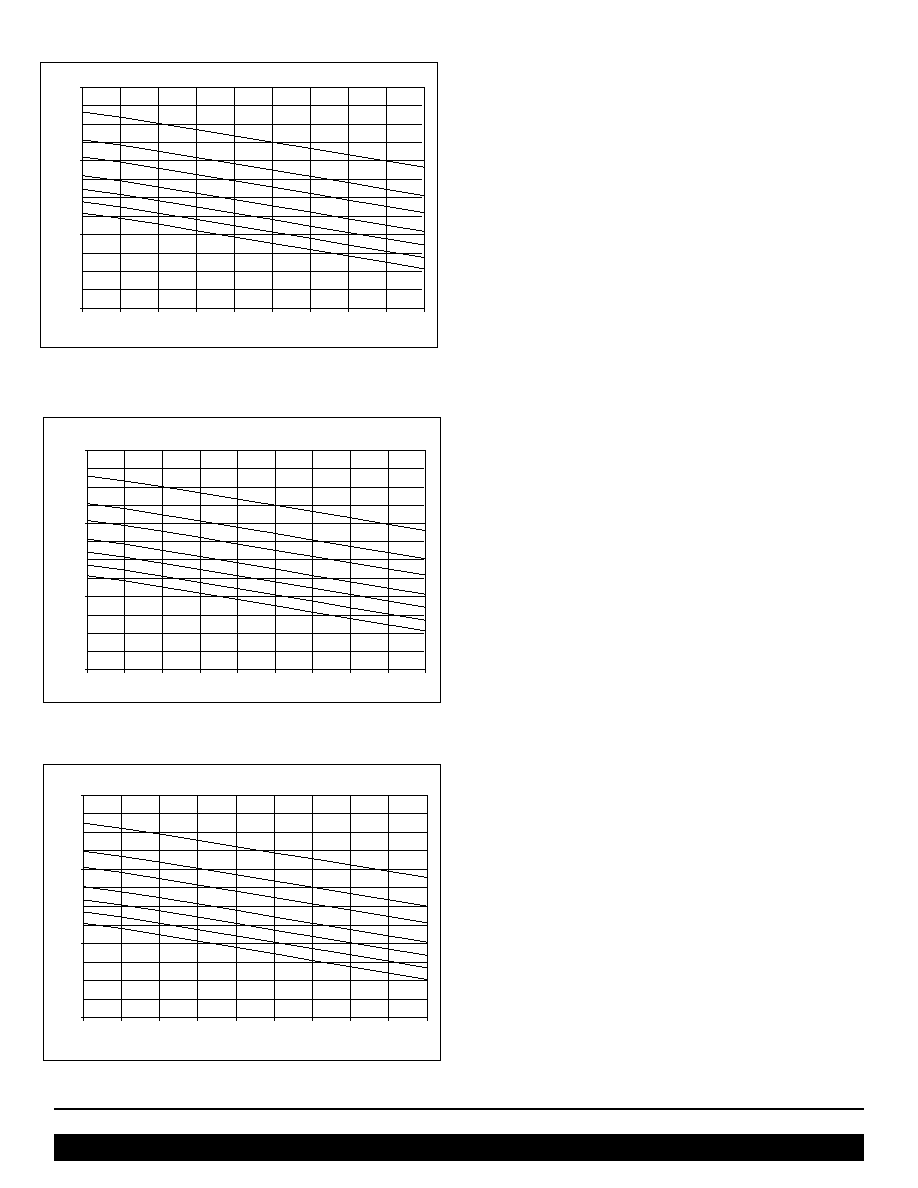
LOAD Current
1 A
2 A
3 A
4 A
5 A
6 A
7 A
8 A
9 A
1 0 A
0 V
2 0 0 m V
4 0 0 m V
6 0 0 m V
V
HEADRO
O
M
Headroom vs. Load, Vout = 3.3V
R
HR
= 14.3k
R
HR
= 16.5k
R
HR
= 18.2k
R
HR
= 20.5k
R
HR
= 22.6k
R
HR
= 24.9k
R
HR
= 27.4k
1 A
2 A
3 A
4 A
5 A
6 A
7 A
8 A
9 A
1 0 A
LOAD Current
0 V
2 0 0 m V
4 0 0 m V
6 0 0 m V
V
HEADROOM
Headroom vs. Load, Vout = 15V
R
HR
= 64.9k
R
HR
= 75k
R
HR
= 82.5k
R
HR
= 93.1k
R
HR
= 102k
R
HR
= 113k
R
HR
= 124k
Figure 11 ≠ Headroom vs Current @ 3.3V with 150mV of slope
adjust from 0.1A to 10A
Figure 12 ≠ Headroom vs Current @ 15V with 150mV of slope
adjust from 0.1A to 10A
1 A
2 A
3 A
4 A
5 A
6 A
7 A
8 A
9 A
1 0 A
LOAD Current
0 V
2 0 0 m V
4 0 0 m V
6 0 0 m V
V
H
E
A
D
R
O
O
M
Headroom vs. Load, Vout = 28V
R
HR
= 121k
R
HR
= 140k
R
HR
= 154k
R
HR
= 174k
R
HR
= 191k
R
HR
= 210k
R
HR
= 232k
Figure 13 ≠ Headroom vs Current @ 28V with 150mV of slope
adjust from 0.1A to 10A
Figures 11, 12, and 13 show the headroom performance at 3.3,
15, and 28 volts respectively with an R
SA
= 8.2k for the three plots.
Set your site on PICOR at www.picorpower.com
PRELIMINARY
Vicor Corp. Tel: 800-735-6200, 978-470-2900 Fax: 978-475-6715
QPO-1 Data Sheet
Page 7 of 8
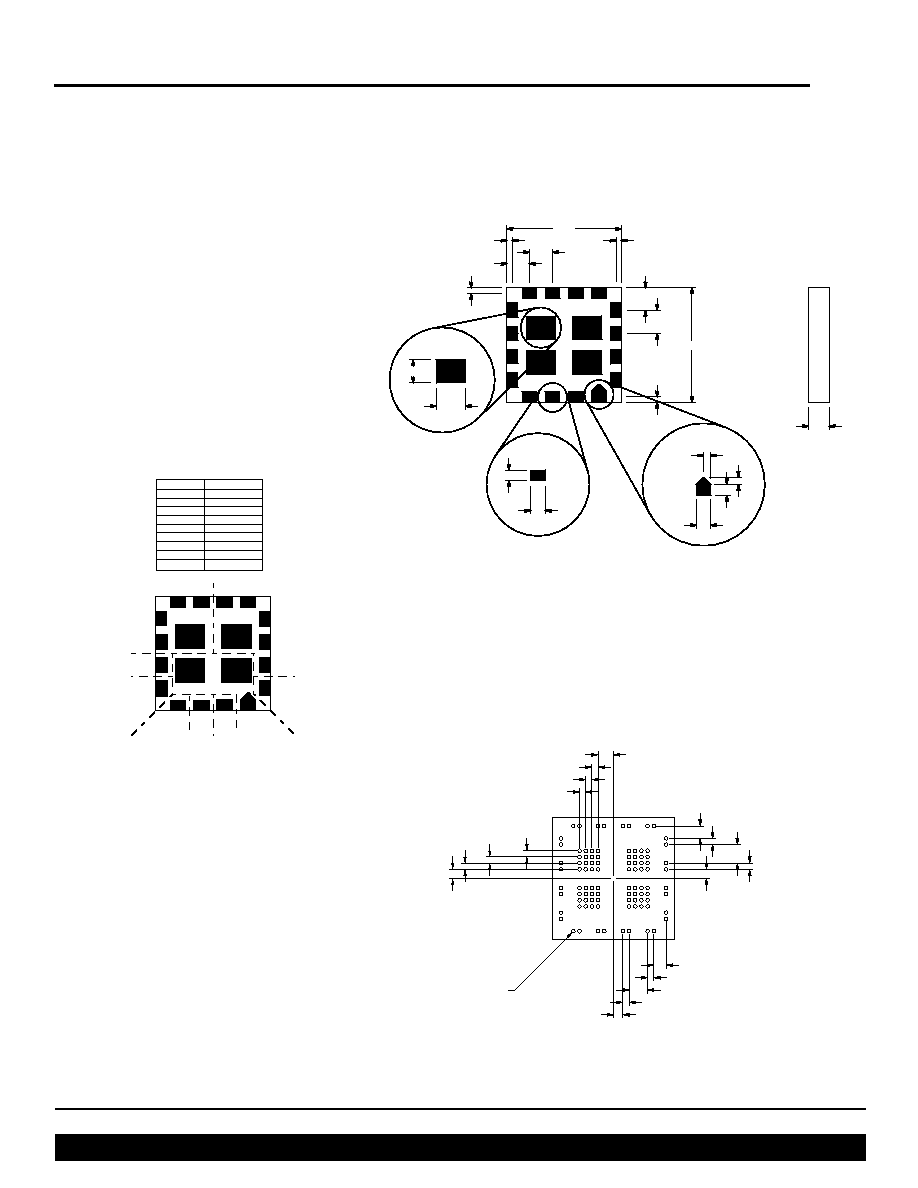
Mechanical Drawings
0.984
0.984
0.192
0.200
0.192
0.200
0.092
0.125
0.125
0.092
0.062
0.062
0.250
0.200
0.046
0.046
0.046
0.046
SiP Bottom View
Pad Dimensions and Locations
0.177
±
0.006
Detail A (4 places)
Detail B (15 places)
Detail C (1 place)
(96 places)
0.125
0.050
0.050
0.050
0.075
0.050
0.050
0.050
0.075
0.050
0.150
0.050
0.075
0.050
0.150
0.050
0.100
0.100
ˇ0.030
C
L
C
L
BGA Pattern
LGA Pattern
SiP Bottom View
Pad Designations
GND
SC
V
IN
V
OUT
SC SET
CESR
REFGND
VREF
SLOPE ADJ
1
2
3
4
5
6
7
17
18
19
20
RAMIN
RAMOUT
GND
SC SET
CESR
SC
REFGND
VREF
SLOPE ADJ
11,12,13,14,18
7,8,9,10,17
1,19,20
6
5
16
4
3
2
10
11
12
9
8
13
14
15
16
PEAK
IN
15
PEAKIN

Vicor Corp. Tel: 800-735-6200, 978-470-2900 Fax: 978-475-6715
QPO-1 Data Sheet
P/N 26090
Rev. 1.0
12/02/10M
Set your site on VICOR at www.vicorpower.com
Vicor's comprehensive line of power solutions includes modular, high-
density AC-DC & DC-DC modules and accessory components, fully
configurable AC-DC & DC-DC power supplies, and complete custom
power systems.
Information furnished by Vicor is believed to be accurate and reliable. However, no responsibility is
assumed by Vicor for its use. No license is granted by implication or otherwise under any patent or patent
rights of Vicor. Vicor components are not designed to be used in applications, such as life support systems,
wherein a failure or malfunction could result in injury or death. All sales are subject to Vicor's Terms and
Conditions of Sale, which are available upon request.
Specifications are subject to change without notice.
Vicor Corporation
25 Frontage Road
Andover, MA, USA 01810
Tel: 800-735-6200
Fax: 978-475-6715
Email
Vicor Express: vicorexp@vicr.com
Technical Support: apps@vicr.com
Component Solutions
for Your Power System
4
5