 | –≠–ª–µ–∫—Ç—Ä–æ–Ω–Ω—ã–π –∫–æ–º–ø–æ–Ω–µ–Ω—Ç: TLMH3100 | –°–∫–∞—á–∞—Ç—å:  PDF PDF  ZIP ZIP |
TLM.310.
Vishay Telefunken
1 (12)
Rev. A1, 04-Feb-99
www.vishay.de
∑
FaxBack +1-408-970-5600
Document Number 83032
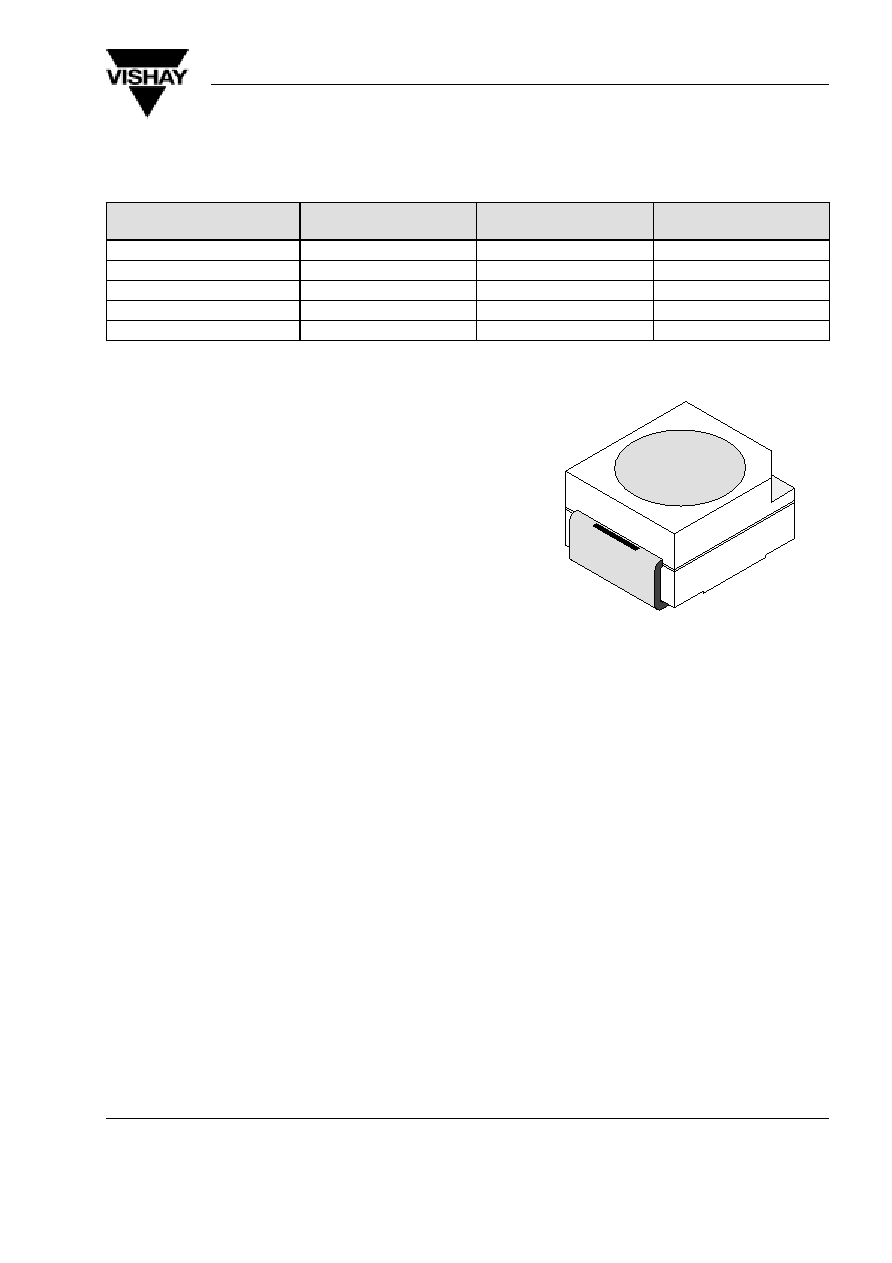
SMD LED in P≠LCC≠2 Package
Color
Type
Technology
Angle of Half Intensity
±
ˆ
High efficiency red
TLMH3100
GaAsP on GaP
60
∞
Soft orange
TLMO3100
GaAsP on GaP
60
∞
Yellow
TLMY3100
GaAsP on GaP
60
∞
Green
TLMG3100
GaP on GaP
60
∞
Pure green
TLMP3100
GaP on GaP
60
∞
Description
These devices have been designed to meet the
increasing demand for surface mounting technology.
The package of the TLM.310. is the P≠LCC≠2
(equivalent to a size B tantalum capacitor).
It consists of a lead frame which is surrounded with a
white thermoplast. The reflector inside this package is
filled up with clear epoxy.
Features
D
SMD LEDs with exceptional brightness
D
Luminous intensity categorized
D
Compatible with automatic placement equipment
D
EIA and ICE standard package
D
Compatible with infrared, vapor phase and wave
solder processes according to CECC
D
Available in 8 mm tape
D
Low profile package
D
Non-diffused lens: excellent for coupling to light
pipes and backlighting
D
Low power consumption
D
Luminous intensity ratio in one packaging unit
I
Vmax
/I
Vmin
x
2.0
94 8553
Applications
Automotive: backlighting in dashboards and switches
Telecommunication: indicator and backlighting in telephone and fax
Indicator and backlight for audio and video equipment
Indicator and backlight in office equipment
Flat backlight for LCDs, switches and symbols
General use
TLM.310.
Vishay Telefunken
2 (12)
Rev. A1, 04-Feb-99
www.vishay.de
∑
FaxBack +1-408-970-5600
Document Number 83032
Absolute Maximum Ratings
T
amb
= 25
_
C, unless otherwise specified
TLMH3100 ,
TLMO3100
,
TLMY3100
,
TLMG3100
,
TLMP3100
Parameter
Test Conditions
Symbol
Value
Unit
Reverse voltage
V
R
6
V
DC forward current
T
amb
60
∞
C
I
F
30
mA
Surge forward current
t
p
10
m
s
I
FSM
0.5
A
Power dissipation
T
amb
60
∞
C
P
V
100
mW
Junction temperature
T
j
100
∞
C
Operating temperature range
T
amb
≠40 to +100
∞
C
Storage temperature range
T
stg
≠55 to +100
∞
C
Soldering temperature
t
5 s
T
sd
260
∞
C
Thermal resistance junction/ambient
mounted on PC board
(pad size > 16 mm
2
)
R
thJA
400
K/W
Optical and Electrical Characteristics
T
amb
= 25
_
C, unless otherwise specified
High efficiency red (
TLMH3100 )
Parameter
Test Conditions
Type
Symbol
Min
Typ
Max
Unit
Luminous intensity
I
F
= 10 mA
I
V
2.5
6
mcd
Dominant wavelength
I
F
= 10 mA
l
d
612
625
nm
Peak wavelength
I
F
= 10 mA
l
p
635
nm
Angle of half intensity
I
F
= 10 mA
±
60
deg
Forward voltage
I
F
= 20 mA
V
F
2.4
3
V
Reverse voltage
I
R
= 10
m
A
V
R
6
15
V
Junction capacitance
V
R
= 0, f = 1 MHz
C
j
15
pF
Soft orange (
TLMO3100 )
Parameter
Test Conditions
Type
Symbol
Min
Typ
Max
Unit
Luminous intensity
I
F
= 10 mA
I
V
2.5
8
mcd
Dominant wavelength
I
F
= 10 mA
l
d
598
611
nm
Peak wavelength
I
F
= 10 mA
l
p
605
nm
Angle of half intensity
I
F
= 10 mA
±
60
deg
Forward voltage
I
F
= 20 mA
V
F
2.4
3
V
Reverse voltage
I
R
= 10
m
A
V
R
6
15
V
Junction capacitance
V
R
= 0, f = 1 MHz
C
j
15
pF
TLM.310.
Vishay Telefunken
3 (12)
Rev. A1, 04-Feb-99
www.vishay.de
∑
FaxBack +1-408-970-5600
Document Number 83032
Yellow (
TLMY3100 )
Parameter
Test Conditions
Type
Symbol
Min
Typ
Max
Unit
Luminous intensity
I
F
= 10 mA
I
V
2.5
6
mcd
Dominant wavelength
I
F
= 10 mA
l
d
581
594
nm
Peak wavelength
I
F
= 10 mA
l
p
585
nm
Angle of half intensity
I
F
= 10 mA
±
60
deg
Forward voltage
I
F
= 20 mA
V
F
2.4
3
V
Reverse voltage
I
R
= 10
m
A
V
R
6
15
V
Junction capacitance
V
R
= 0, f = 1 MHz
C
j
15
pF
Green (
TLMG3100 )
Parameter
Test Conditions
Type
Symbol
Min
Typ
Max
Unit
Luminous intensity
I
F
= 10 mA
I
V
4
9
mcd
Dominant wavelength
I
F
= 10 mA
l
d
562
575
nm
Peak wavelength
I
F
= 10 mA
l
p
565
nm
Angle of half intensity
I
F
= 10 mA
±
60
deg
Forward voltage
I
F
= 20 mA
V
F
2.4
3
V
Reverse voltage
I
R
= 10
m
A
V
R
6
15
V
Junction capacitance
V
R
= 0, f = 1 MHz
C
j
15
pF
Pure green (
TLMP3100 )
Parameter
Test Conditions
Type
Symbol
Min
Typ
Max
Unit
Luminous intensity
I
F
= 10 mA
I
V
1
4
mcd
Dominant wavelength
I
F
= 10 mA
l
d
555
565
nm
Peak wavelength
I
F
= 10 mA
l
p
555
nm
Angle of half intensity
I
F
= 10 mA
±
60
deg
Forward voltage
I
F
= 20 mA
V
F
2.4
3
V
Reverse voltage
I
R
= 10
m
A
V
R
6
15
V
Junction capacitance
V
R
= 0, f = 1 MHz
C
j
15
pF
TLM.310.
Vishay Telefunken
4 (12)
Rev. A1, 04-Feb-99
www.vishay.de
∑
FaxBack +1-408-970-5600
Document Number 83032
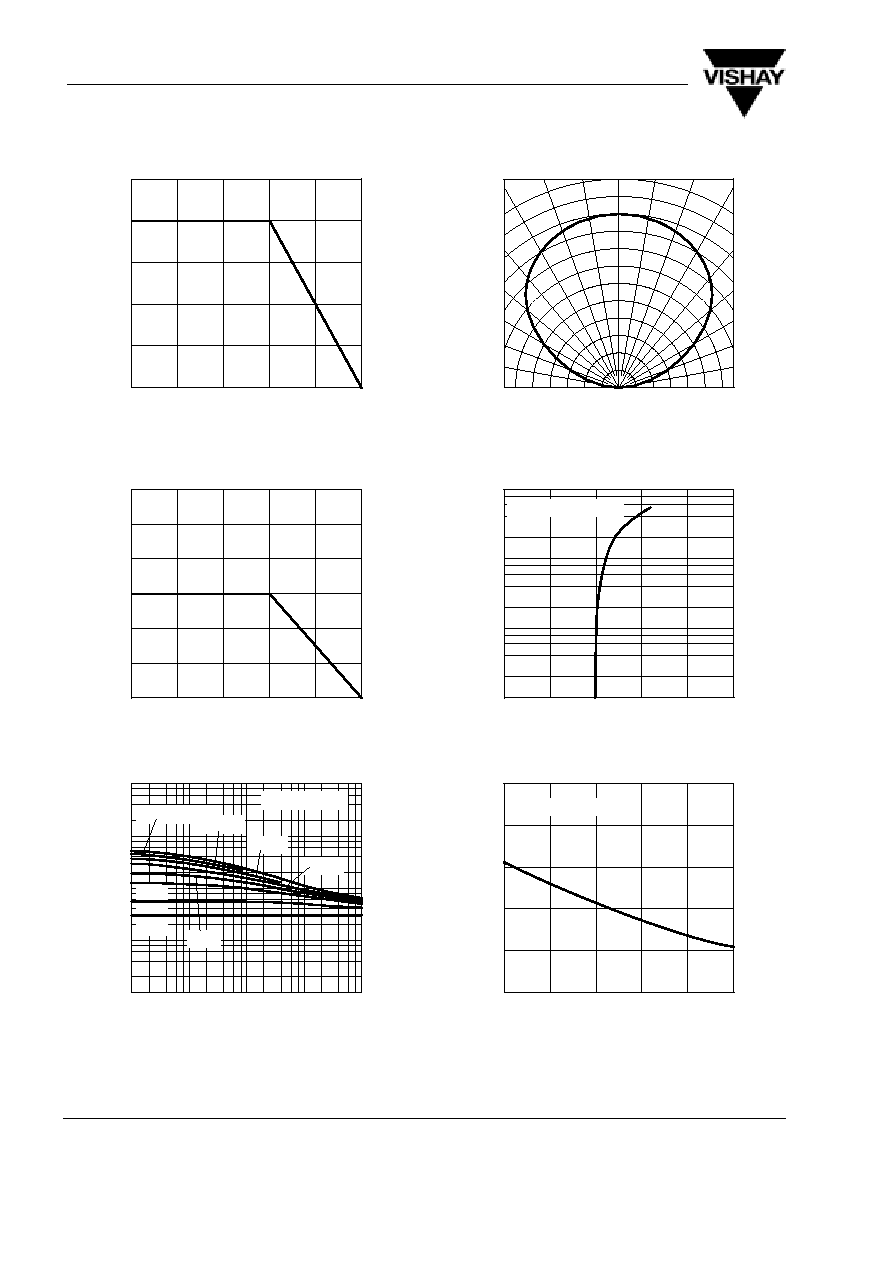
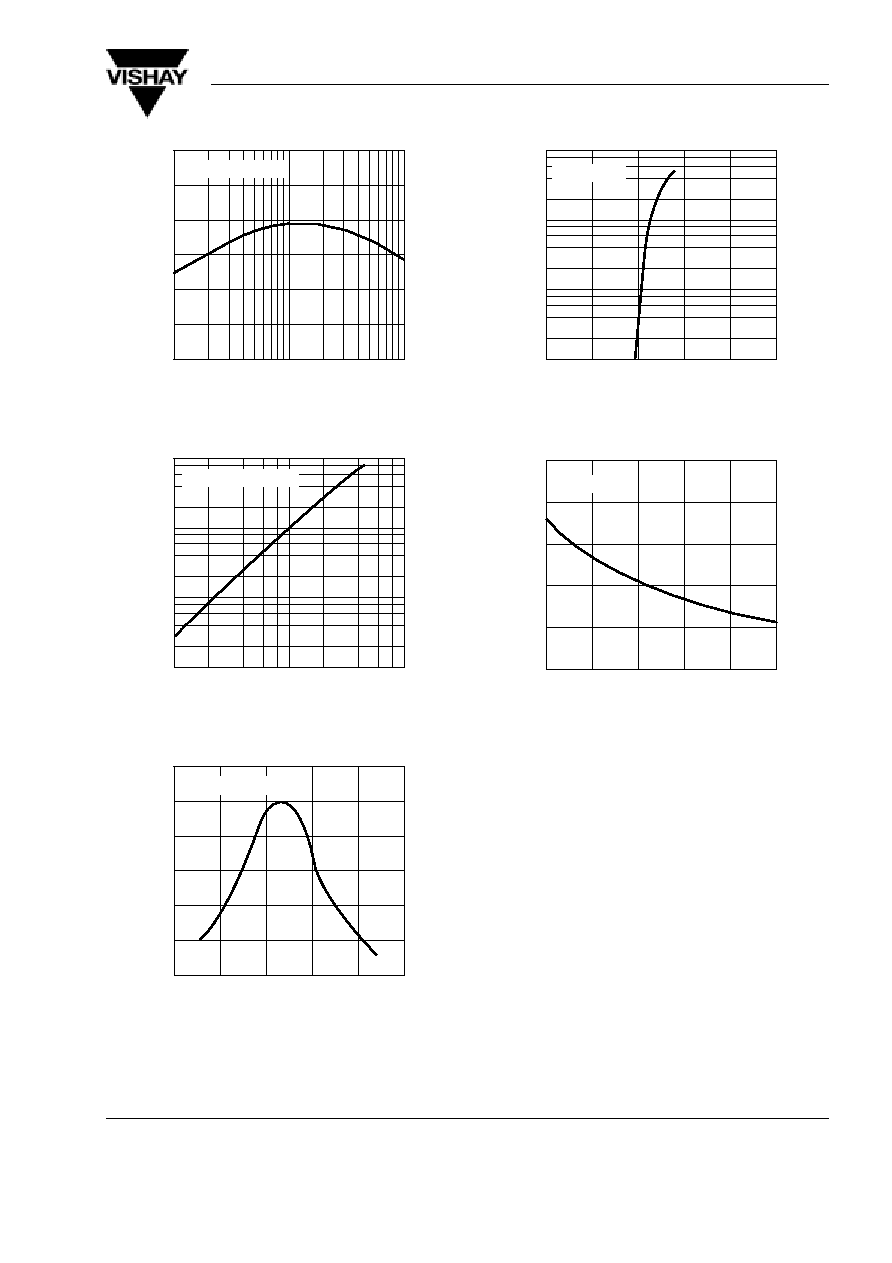
Typical Characteristics (T
amb
= 25
_
C, unless otherwise specified)
0
20
40
60
80
0
25
50
75
100
125
P
≠ Power Dissipation ( mW
)
V
T
amb
≠ Ambient Temperature (
∞
C )
100
95 10904
Figure 1 Power Dissipation vs. Ambient Temperature
0
10
20
30
40
60
0
20
40
60
80
I ≠ Forward Current ( mA
)
F
T
amb
≠ Ambient Temperature (
∞
C )
100
95 10905
50
Figure 2 Forward Current vs. Ambient Temperature
0.01
0.1
1
10
1
10
100
1000
10000
t
p
≠ Pulse Length ( ms )
100
95 9985
I ≠ Forward Current ( mA
)
F
DC
t
p
/T=0.005
0.5
0.2
0.1
0.01
0.05
0.02
T
amb
v60
∞
C
Figure 3 Forward Current vs. Pulse Length
0.4
0.2
0
0.2
0.4
I ≠ Relative Luminous Intensity
v rel
0.6
95 10319
0.6
0.9
0.8
0
∞
30
∞
10
∞
20
∞
40
∞
50
∞
60
∞
70
∞
80
∞
0.7
1.0
Figure 4 Rel. Luminous Intensity vs.
Angular Displacement
0
1
2
3
4
0.1
1
10
100
V
F
≠ Forward Voltage ( V )
5
95 9989
I ≠ Forward Current ( mA
)
F
High Efficiency Red
Figure 5 Forward Current vs. Forward Voltage
0
20
40
60
80
0
0.4
0.8
1.2
1.6
2.0
100
95 9993
I ≠ Relative Luminous Intensity
v rel
T
amb
≠ Ambient Temperature (
∞
C )
High Efficiency Red
Figure 6 Rel. Luminous Intensity vs.
Ambient Temperature
TLM.310.
Vishay Telefunken
5 (12)
Rev. A1, 04-Feb-99
www.vishay.de
∑
FaxBack +1-408-970-5600
Document Number 83032
10
20
50
100
200
0
0.4
0.8
1.2
1.6
2.4
95 10321
500
0.5
0.2
0.1
0.05
0.02
1
I
F
(mA)
t
p
/T
I ≠ Relative Luminous Intensity
v rel
2.0
High Efficiency Red
Figure 7 Rel. Lumin. Intensity vs.
Forw. Current/Duty Cycle
1
10
0.01
0.1
1
10
I
F
≠ Forward Current ( mA )
100
95 9995
I ≠ Relative Luminous Intensity
v rel
High Efficiency Red
Figure 8 Relative Luminous Intensity vs. Forward Current
590
610
630
650
670
0
0.2
0.4
0.6
0.8
1.2
690
95 10040
I ≠ Relative Luminous Intensity
v rel
l ≠ Wavelength ( nm )
1.0
High Efficiency Red
Figure 9 Relative Luminous Intensity vs. Wavelength
0
1
2
3
4
0.1
1
10
100
V
F
≠ Forward Voltage ( V )
5
95 9990
I ≠ Forward Current ( mA
)
F
Soft Orange
Figure 10 Forward Current vs. Forward Voltage
0
20
40
60
80
0
0.4
0.8
1.2
1.6
2.0
100
95 9994
I ≠ Relative Luminous Intensity
v rel
T
amb
≠ Ambient Temperature (
∞
C )
Soft Orange
Figure 11 Rel. Luminous Intensity vs.
Ambient Temperature